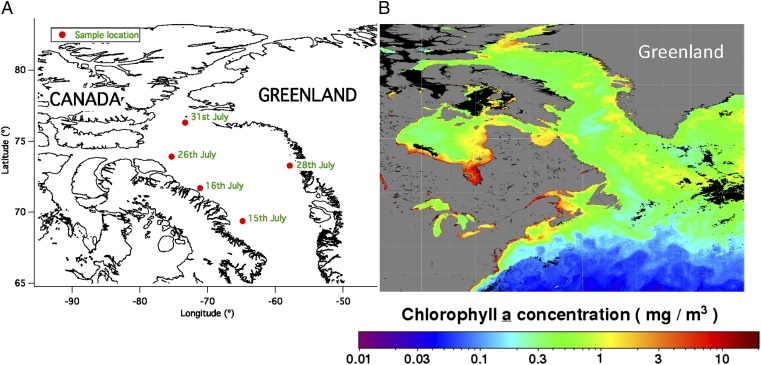
Fig. S4.
(A) Sample locations and dates for DFT samples onboard the RV Amundsen during the NETCARE study in 2014. (B) Ocean Chl a concentrations in the region interpreted from satellite ocean color measurements during the month of July 2014 were processed and made available by the NASA Ocean Biology Distributed Active Archive Center (OB.DAAC).

