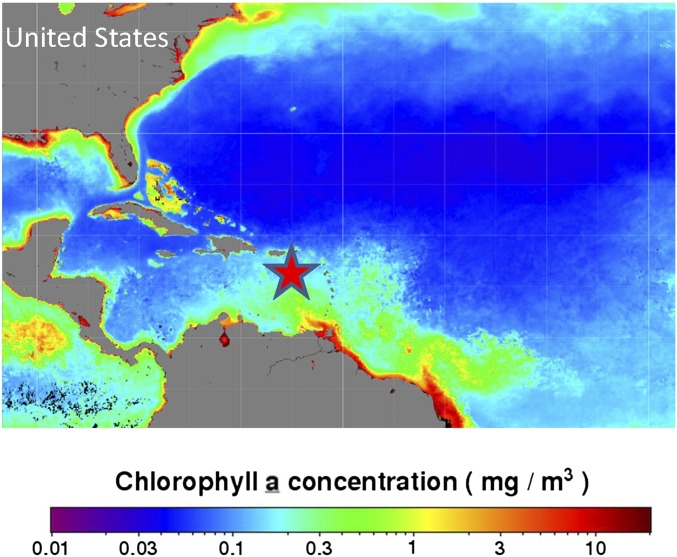
Fig. S5.
As for Fig. S4, but with a star indicating the approximate central location of aircraft flight tracks in the MBL during the ICE-T study in July 2011. The sampling region is indicated on a map of integrated Chl a concentration for the month of July, averaged for the period 2012–2014, and were processed and made available by the NASA Ocean Biology Distributed Active Archive Center (OB.DAAC).

