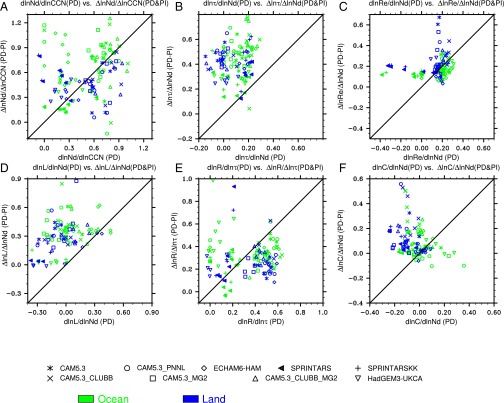
Fig. 2.
Relationships between (A) droplet number and CCN concentration, (B) cloud optical depth and droplet number concentration, (C) droplet effective radius and droplet number concentration, (D) liquid water path and droplet number concentration, (E) cloud radiative forcing and cloud optical depth, and (F) low cloud fraction and droplet number concentration, estimated from PD–PI change vs. spatial and temporal variability during PD conditions for each model, averaged within each of the 14 regions defined by Quaas et al. (43).

