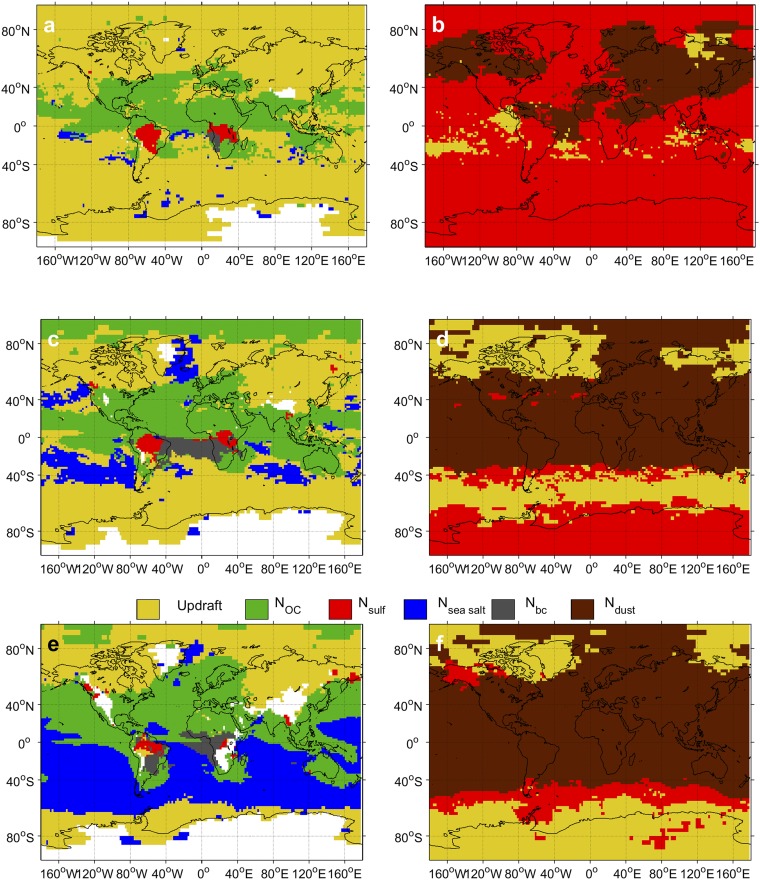
Fig. S1.
Primary attribution grids, i.e., grid cells colored according to the input variable whose temporal attribution, , is largest at (A) 825 hPa, (C) 875 hPa, and (E) 925 hPa for liquid droplets and at (B) 250 hPa, (D) 350 hPa, and (F) 450 hPa for ice crystals. Values are taken from the DEF-Gyr simulation, a yearlong GEOS-5 simulation at 2° spatial resolution, using the Phillips et al. (20) heterogeneous nucleation spectrum. One daily averaged set of inputs and sensitivities is recorded per day. Then the annual variance of these inputs and mean of these sensitivities are used in the calculation of Eq. 1. Grid cells and time points for which new hydrometeor formation is negligible, i.e., and , are filtered out; regions of negligible cloud hydrometeor formation over the month are shown in white.

