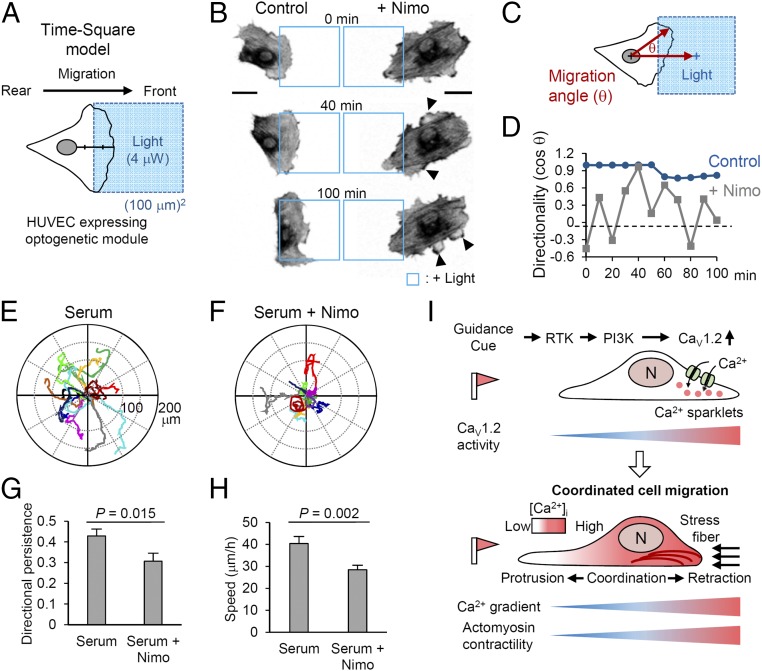
Fig. 4.
Effects of the front-to-rear Ca2+ gradient on motile pattern. (A) Basic scheme of the time-square model. A square-shaped blue light (blue box) illuminates an area in the anterior half (midpoint between front edge and border of nucleus) of HUVECs expressing an optogenetic module. See SI Materials and Methods. (B) Lifeact images (inverted contrast) of directionally migrating HUVECs under optoFGFR1 guidance (time-square model), with and without nimodipine treatment. Blue squares represent the illuminated region; arrowheads indicate lateral lamellipodia. (C) Schematic illustration of the method for determining migration angle (θ), where θ is the angle between the migrating direction and the central axis of the illuminated region. (D) Time course of the directionality (cos θ) of an optoFGFR1-expressing HUVEC (blue) and the cell treated with nimodipine (gray). (E and F) Migrating paths of HUVECs (10 h) in serum-supplemented media with and without nimodipine treatment. (G and H) Directional persistence (displacement/total path) and speed of migrating HUVECs. n = 50 (serum) and n = 40 (serum + Nimo). Data are represented as mean ± SEM, two-tailed t test. (I) Proposed model of front–rear coordination in directed cell migration. Polarized CaV1.2 activity establishes a Ca2+ gradient that maintains cell polarity by inducing actomyosin contractility in the rear part of the migrating cell. (Scale bars: 20 μm.)

