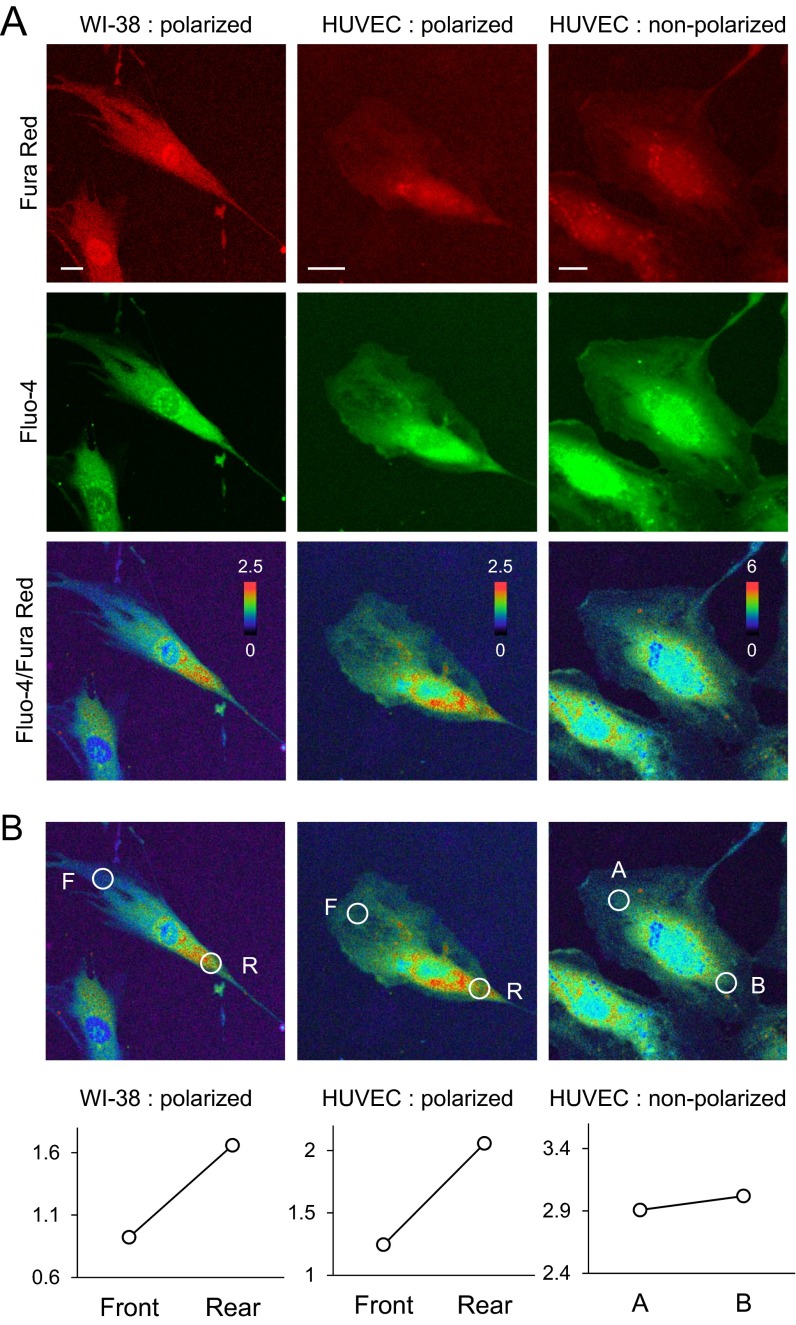
Fig. S5.
Representative images of [Ca2+]i gradient detected by ratiometric confocal Ca2+ measurement. (A) Raw images of Fura red (red), Fluo-4 (green), and Fluo/Fura ratio view of WI-38 fibroblast and HUVECs. (B) Quantitative data of [Ca2+]i steepness. White circles indicate the front and rear endpoint for the steepness measurement. F, front; R, rear. (Scale bars: 20 μm.)

