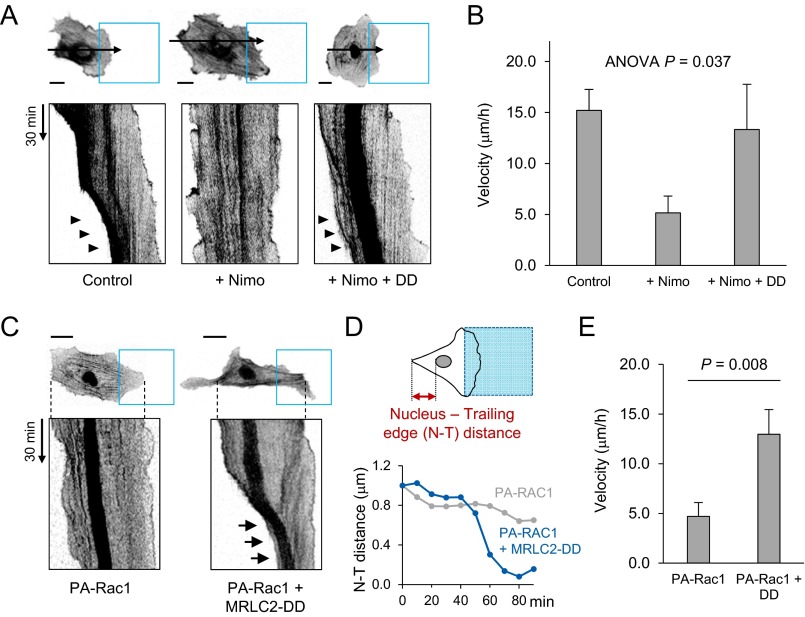
Fig. S7.
The role of Ca2+ sparklet in front–rear coordination. (A and B) Motile pattern (A) and migration velocity (B) of optoFGFR1-expressing HUVECs in the time-square model. Blue squares represent the illuminated region; arrows indicate line-scanned area; arrowheads indicate rear retraction. Control: DMSO treatment, n = 10; +Nimo: nimodipine treatment, n = 12; +Nimo +DD: nimodipine treatment in cells expressing phosphomimetic mutant of MRLC2-DD, n = 12. Data are represented as mean ± SEM, one-way ANOVA. (C) iRFP682-Lifeact and FusionRed-Nuc (nucleus marker) signals (inverted contrast) of HUVECs without (Left) or with (Right) MRLC2-DD overexpression under optically induced directional migration. Blue boxes indicate illuminated regions. Arrows highlight rear retraction and nucleus movement. (D) Time course of changes in nucleus–trailing edge (N–T) distance of the cells in C. (E) Velocity of HUVECs expressing PA-Rac1 (PA-Rac1, n = 8) or coexpressing PA-Rac1 and MRLC2-DD (PA-Rac1 + DD, n = 8) undergoing optically induced directional migration. Data are represented as mean ± SEM, two-tailed t test. (Scale bars: 20 μm.)

