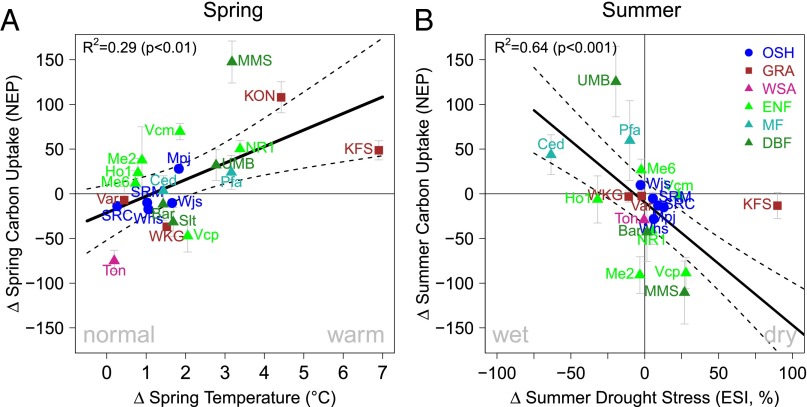
Fig. 1.
Seasonal climate anomalies increased net carbon uptake in spring but led to reductions in summer throughout the United States in 2012. Flux tower-derived seasonal anomalies of NEP (g C m−2) during spring (A) and summer (B; related to drought stress via the ESI) in 2012 relative to the baseline of 2008–2010. Symbols and colors denote the International Geosphere-Biosphere Program (IGBP) land-use classes, which are provided with the site names and abbreviations in SI Appendix, Table S1. Error bars denote the uncertainties in the flux anomalies. Dashed lines represent the confidence interval of the ordinary least squares mean regression (bold line). The summer anomaly at the site KON is out of scale (SI Appendix, Table S10) and was omitted from display only. Further details are provided in SI Appendix, Figs. S3, S15, and S16).

