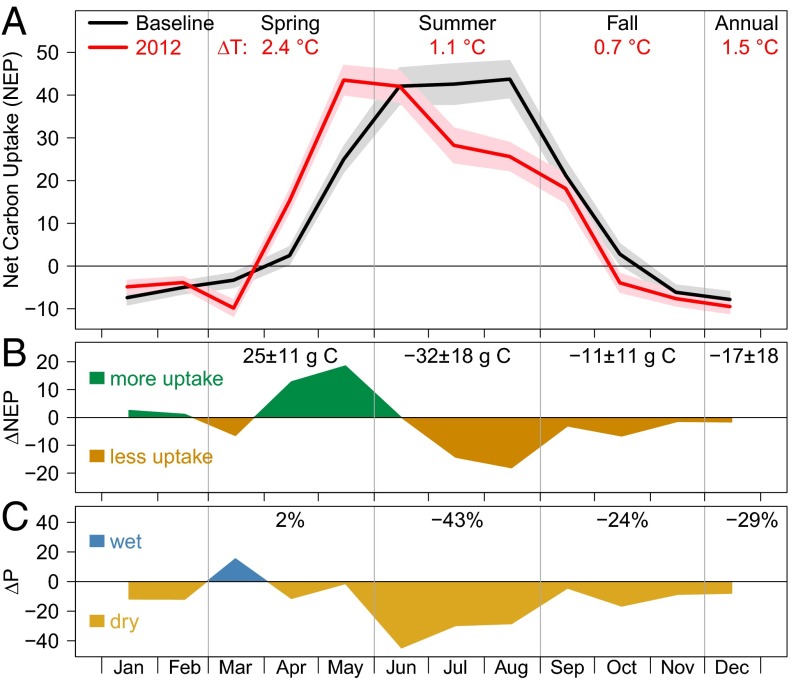
Fig. 2.
Net carbon uptake of concurrent warm spring and summer drought in 2012. (A) Ensemble mean of EC-measured monthly NEP (g C m−2 mo−1) for 2012 (red) and baseline (black) at sites that experienced drought during summer 2012 (n = 13). Numbers atop show the mean seasonal temperature (T) anomalies in 2012 relative to the baseline of 2008–2010. (B) Anomalies of NEP (g C m−2 mo−1) in 2012 relative to the mean baseline; numbers atop denote the seasonal anomalies (g C m−2) and their uncertainties, which were derived from Monte-Carlo simulations of monthly fluxes (also shading in A). (C) Anomalies of monthly precipitation (mm mo−1) in 2012 relative to baseline; numbers atop show seasonal anomalies. Similar ensemble analyses for GPP and SPI can be found in SI Appendix, Fig. S4.

