Fig. 3.
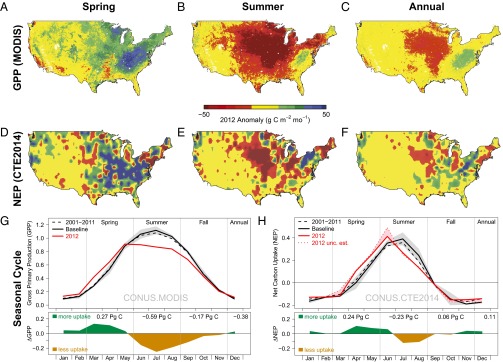
Increased carbon uptake in the eastern United States during the warm spring of 2012 compensated for large reductions by the summer drought in the Midwest. Spatiotemporal anomalies are shown for GPP (g C m−2 mo−1) from MODIS (A–C) and NEP (g C m−2 mo−1) from CarbonTracker (CTE2014; D–F) during spring, summer, and annually in 2012 relative to the baseline of 2008–2010. Red/orange colors indicate negative anomalies (reductions), and green/blue colors show positive anomalies (increases). The seasonal cycle of total monthly GPP (G) and NEP (H) (both in Pg C) for the long-term mean (2001–2011, black dashed line), the baseline (black line), and 2012 (red line) integrated across the CONUS. The red dotted line for NEP indicates an uncertainty estimate of CTE2014, based on the independent model run CTE2015. The red shading indicates the 2012 uncertainty range between both model runs. The gray shading indicates the interannual variability (SD) during the baseline. Colored shading in lower panels shows the 2012 anomalies (Pg C) relative to the mean baseline; numbers atop denote seasonal anomalies. Further maps with spatial drought patterns (ESI, SPI), vegetation activity (EVI), and ET can be found in SI Appendix, Fig. S6.

