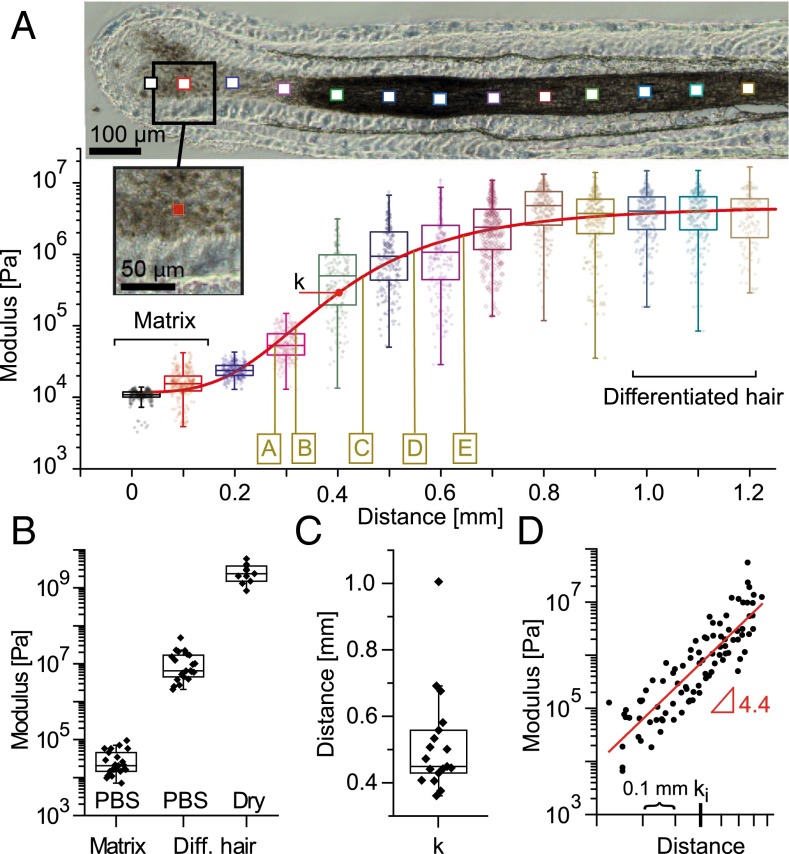
Fig. 1.
Mechanical characterization of the hair follicle. (A) Elastic modulus map for increasing distances along one follicle. Boxplots depict the moduli obtained from 256 force-indentation curves measured in equidistant positions within the corresponding 10 × 10-μm2 areas represented by squares on the optical microscopy picture (actual size depicted in the higher-magnification Inset). The red curve is a sigmoidal function fitted to the logarithmic data (SI Text); k denotes the position of the inflection point. The brown letters denote approximate positions where images shown in Fig. 2 were recorded on the same follicle. (B) Boxplots of the mean moduli measured on different follicles in the keratinocyte matrix and on the plateau (distances > 800 μm) in PBS (n = 25) or after drying the sections (n = 9). (C) Position of the inflection point for different follicles, (n = 18). (D) Moduli increase between ∼200- and ∼900-μm distances from different follicles shown in a log-log plot. Every point corresponds to the mean of a probed 10 × 10-μm2 zone. The traces are aligned on the x axis to their respective inflection points ki (n = 18).

