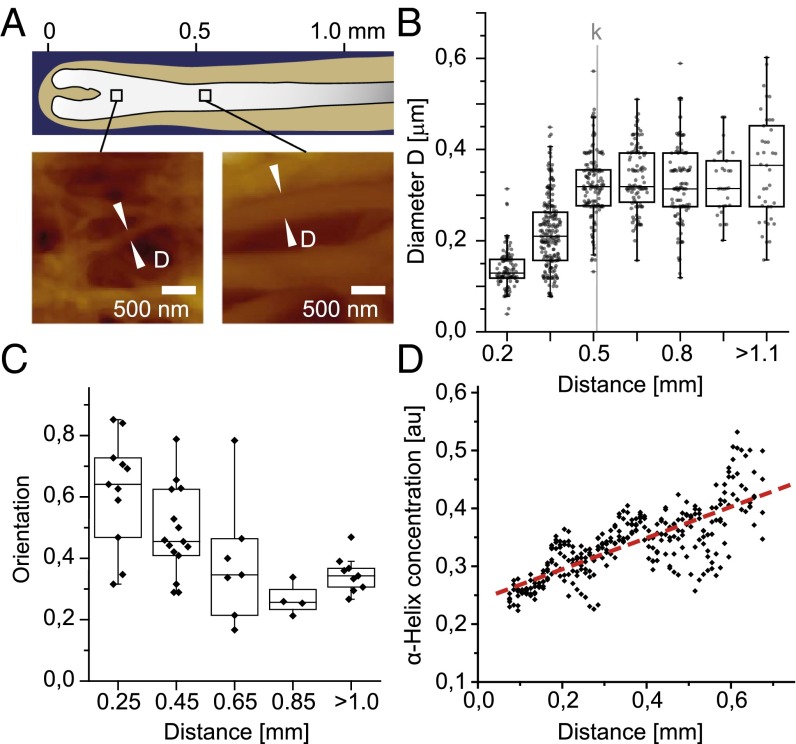
Fig. 3.
Quantification of changes in the network architecture. (A) Quantification of macrofibril diameters D on randomly chosen and zoomed positions along the follicle using the AFM height profiles. (B) Boxplots of macrofibril diameters in dependency on their distance along the follicle axis. The average inflection point k for the mechanical stiffening is shown as gray line. (C) Preferential network orientation given by the ratio of the shortest to the longest decay of the autocorrelation function calculated for different angles. Values close to 1 indicate an isotropic picture, whereas values close to 0 indicate a preferred direction. (D) α-Helical protein concentration (1,652-cm−1 band) measured by synchrotron FT-IR microspectroscopy along the follicle.

