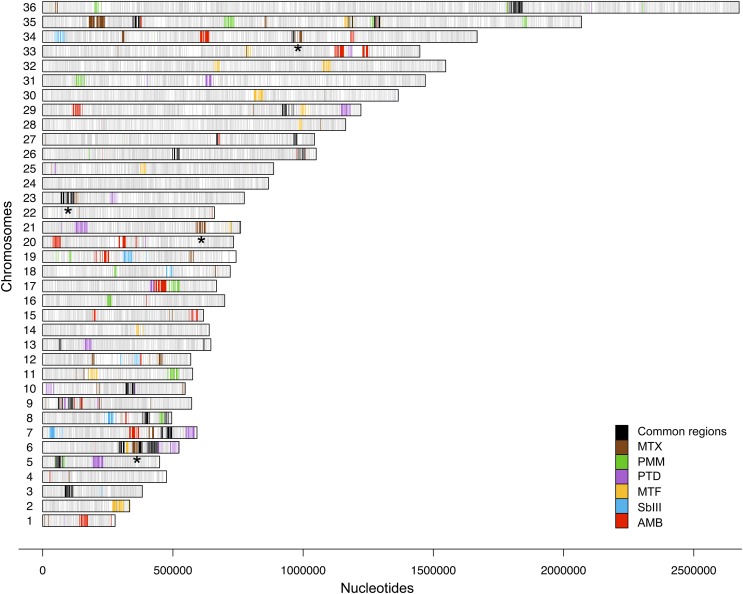
Fig. 2.
Genome-wide distribution of drug-enriched loci. Genes significantly enriched by antileishmanials as revealed by Cos-Seq are shown on one of the 36 Leishmania chromosomes. Genes enriched by both gradual and plateau selection schemes are included. Gray bars represent the gene positions on each chromosome. Colored bars represent genes enriched by the antileishmanials tested according to the color code shown at right. Only genes enriched with a mean log2-fold change of ≥4 are depicted. Black bars highlight loci enriched by at least two drugs and represent possible cross-resistance genes. Asterisks denote the genomic loci enriched by MTX, which are characterized in more detail in Fig. 3. The drug-specific Cos-Seq profiles for gradual and/or plateau selections are provided in SI Appendix, Figs. S3, S6–S9, and S11 for MTX, SbIII, MTF, AMB, PTD, and PMM, respectively. Details on the gene content of Cos-Seq enriched loci are presented in SI Appendix, Table S3.

