Fig. 3.
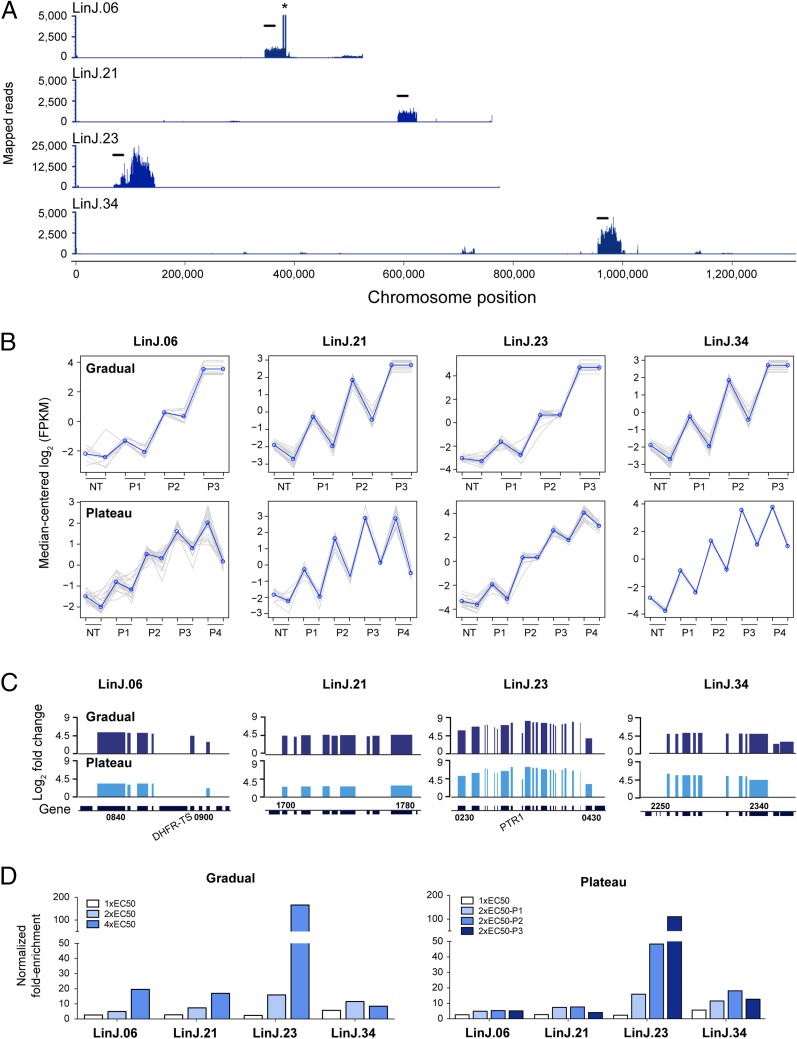
Cos-Seq identification of loci implicated in MTX resistance. (A) Visualization of four representative MTX-enriched loci on chromosomes 6, 21, 23, and 34 as delimited by regions of higher read density. For LinJ.06, the asterisk denotes a bias in read counts coming from the DHFR-TS flanking regions originating from the cLHYG backbone (23). (Scale bars: 20 kb.) (B) Plots of gene clusters sharing similar Cos-Seq profiles from which the four representative MTX-enriched loci were recovered by gradual and plateau selections. Gray lines represent individual genes, and blue lines denote the average profile per cluster. Gene abundance is expressed on the y-axis as log2-transformed FPKM values centered to the median FPKM. Samples are ordered on the abscissa according to the selection procedure, from nontreated (NT) samples to the third drug increment (P3) for gradual selection or the fourth passage (P4) for plateau selection. Gene abundance for the two biological replicates is also shown. “Staircase” patterns are due to differences in gene abundance at baseline between the replicates. For gradual selection, sequencing of the second 4× EC50 replicate (P3) failed, leaving only a single 4× EC50 sample, which was used twice for the analysis. (C) Gene enrichment scores for the four representative MTX-enriched loci. Log2-transformed variation of gene abundance is determined between the last drug concentration (P3 for gradual selection) or passage (P4 for plateau selection) and the nontreated baseline (NT in B). The positions of DHFR-TS and PTR1 on chromosomes 6 and 23, respectively, are shown. Gene numbers indicate the first and last genes found on each enriched locus. (D) Fold enrichment of the four representative cosmids at each increment in MTX concentration (Left) or passage (Right), as normalized to the drug-free control.

