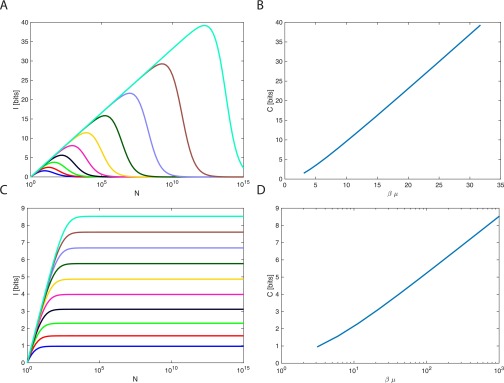
Fig. S1.
(A) Mutual information plotted for the delta distribution for various (log-spaced) . I displays a characteristic rise with , maximum, and then a decay at large N. (B) The capacity is plotted for . As gets large, capacity is linear. (C) Mutual information plotted for the exponential distribution for various (log-spaced) . I displays a characteristic rise with and then plateaus at its maximum. (D) The capacity as a function of for the exponential distribution. As gets large, the capacity goes as (the x axis is log scale).

