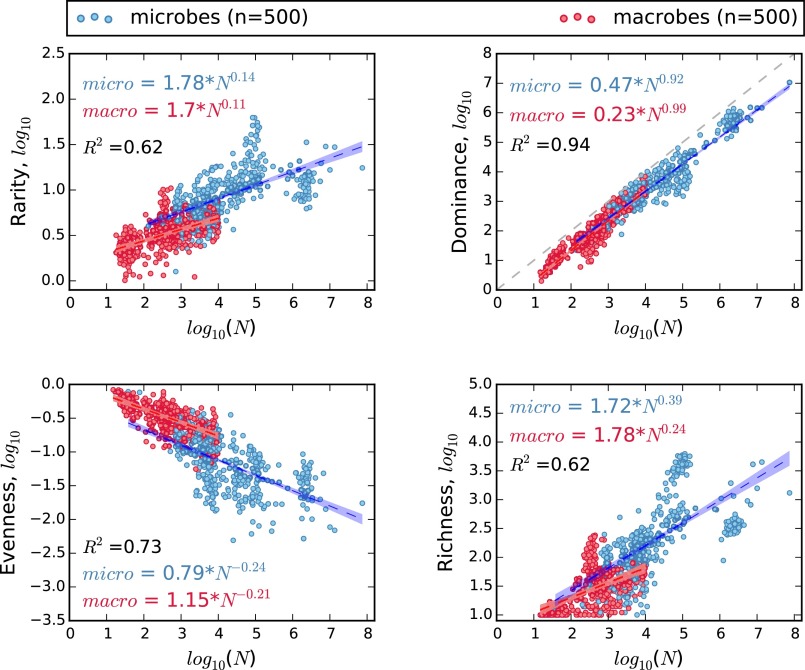
Fig. 1.
Microbial communities (blue dots) and communities of macroscopic plants and animals (red dots) are similar in the rates at which rarity, absolute dominance, and species evenness scale with the number of individuals or genes reads (N). However, for a given N, microbial communities have greater rarity, less evenness, and greater richness than those of macroorganisms. Coefficients and exponents of scaling equations are mean values from 10,000 bootstrapped multiple regressions, with each regression based on 500 microbial and 500 macrobial communities chosen by stratified random sampling. Each scatterplot represents a single random sample; hulls are 95% confidence intervals.

