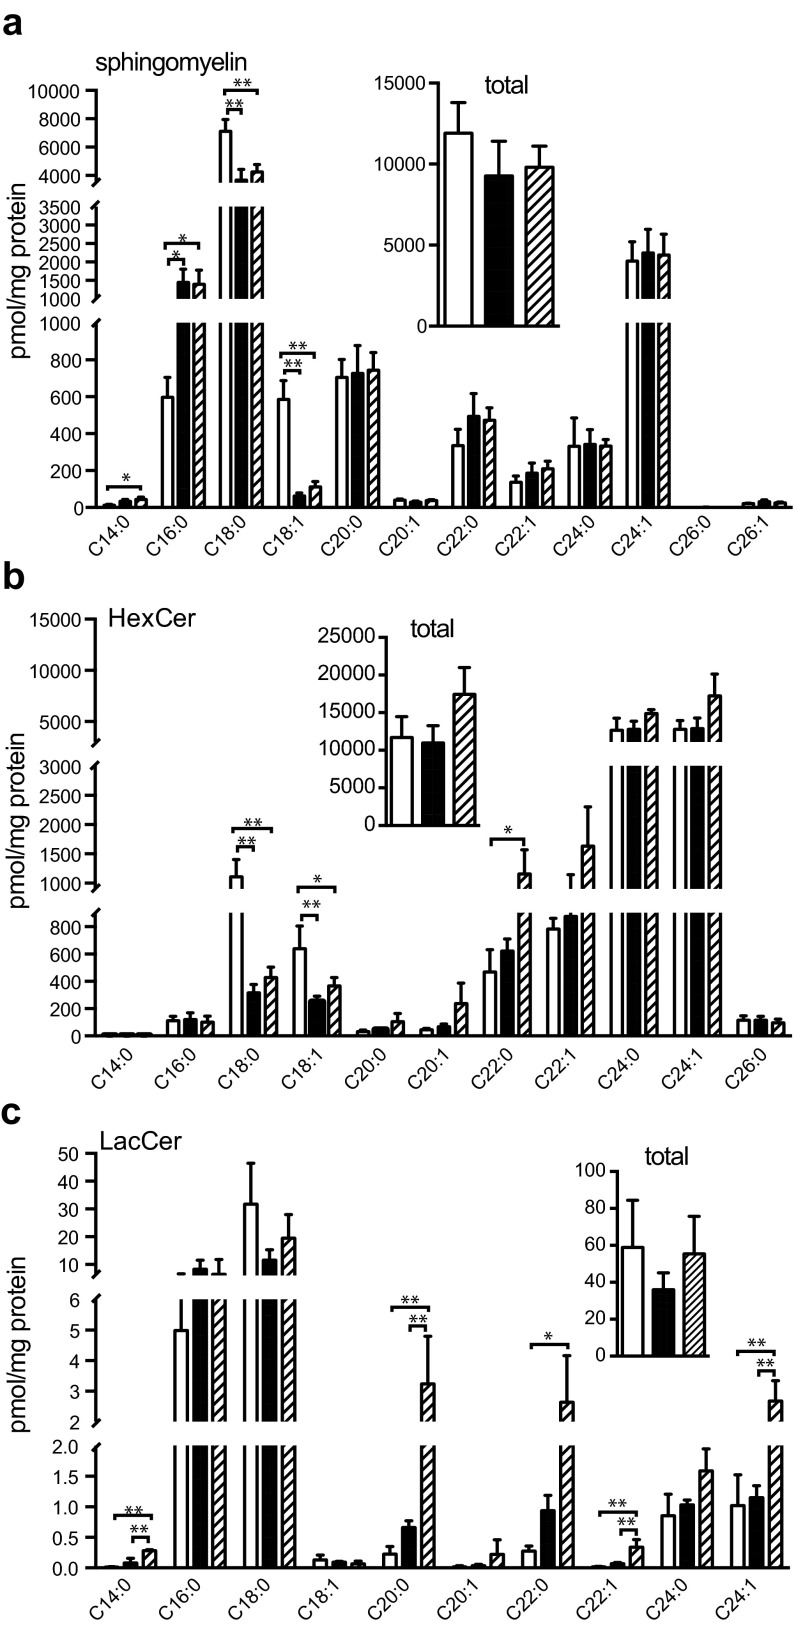
Fig. S2.
Sphingomyelin and simple glycosphingolipid profiles in the brain with neuronal expression of Cers2. (A) Sphingomyelin species and total amount of sphingomyelin (Inset). (B) Hexosylceramide species and total amount of hexosylceramide (Inset). (C) Lactosylceramide species of 40-d-old Cers1 wild-type (+/+, unfilled bars), homozygous Cers1to/to mutant (filled bars), and Cers1to/to;Tg-CerS2 (hatched bars) mice. Three mice (n = 3) of each genotype were used. Values are mean ± SD. *P ≤ 0.05; **P ≤ 0.01 (one-way ANOVA, multiple comparisons).

