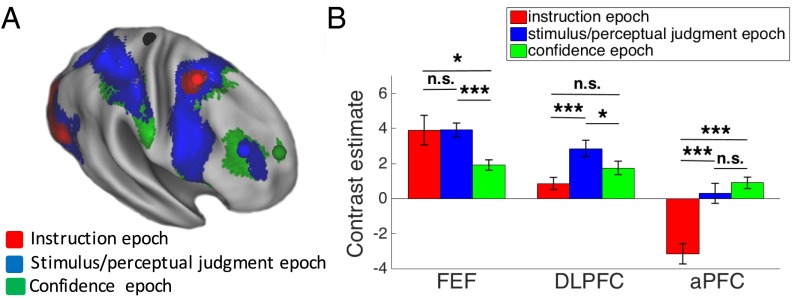
Fig. 4.
fMRI results. (A) Brain activity corresponding to the instruction, stimulus/perceptual judgment, and confidence epochs. A caudal-to-rostral gradient is apparent with later epochs of the trial activating preferentially more rostral regions. The colored spheres are the mean locations of the stimulated S1 (black), FEF (red), DLPFC (blue), and aPFC (green) sites. (B) Mean blood-oxygenation-level–dependent (BOLD) contrast estimate for each trial epoch (beta value difference between the regressor for the relevant epoch and regressor for the “rest” period) is shown for each of the three regions, demonstrating that caudal regions are active earlier in the trial, whereas rostral regions are active later in the trial. Error bars represent SE. *P < 0.05; ***P < 0.001.

