Fig. 3.
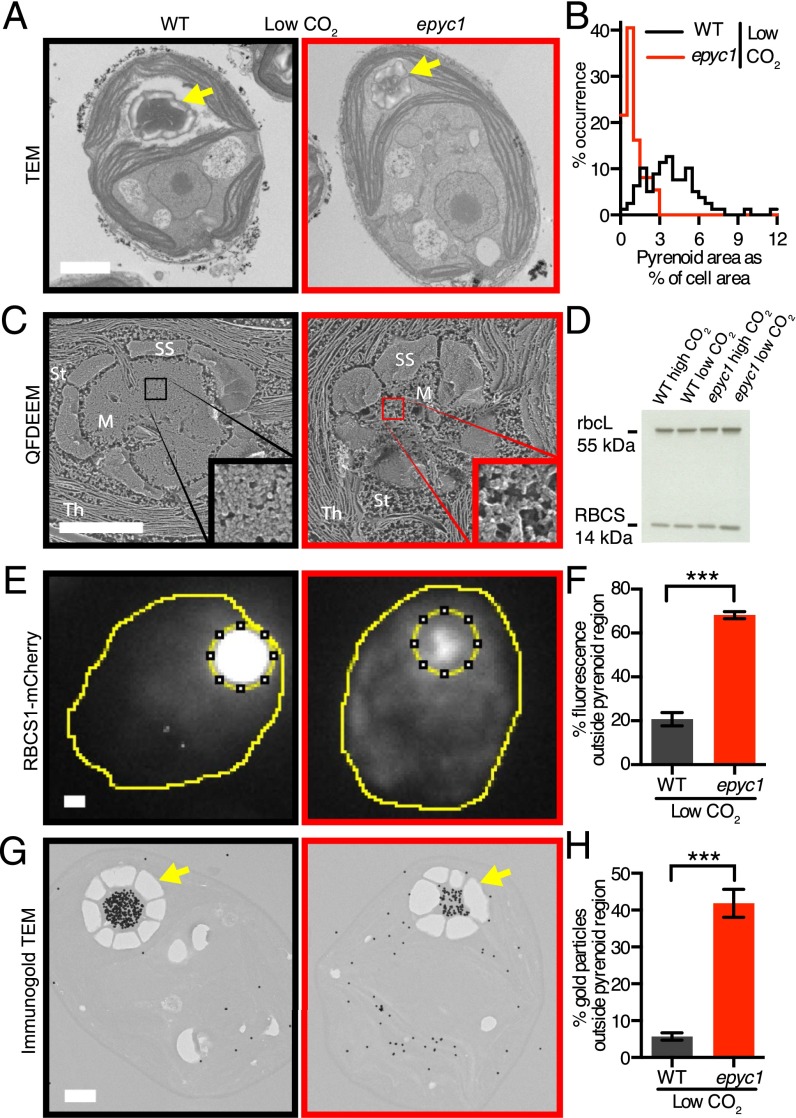
EPYC1 is essential for Rubisco aggregation in the pyrenoid. (A) Representative TEMs of WT and epyc1 cells grown at low CO2. (B) Quantification of the pyrenoid area as a percentage of cell area of WT and epyc1 cells grown at low CO2. Data are from TEM images as represented in A. epyc1: n = 37; WT: n = 79. P < 10−19, Welch’s t test. (C) QFDEEM of the pyrenoid of WT and epyc1 cells grown at low CO2. M, pyrenoid matrix; St, stroma; Th, thylakoids; SS, starch sheath. (Inset) Four hundred percent zoom view of the pyrenoid matrix. (D) Rubisco protein levels in WT and epyc1 cells grown at low and high CO2 were probed by Western blot analysis. (E) Localization of Rubisco was determined by microscopy of WT and the epyc1 mutant containing RBCS1-mCherry. The sum of the fluorescence signals from Z stacks was used for quantitation. (F) The fraction of RBCS1-mCherry signal from outside the pyrenoid region (inner dotted line in E) was quantified in WT and epyc1 cells at low CO2. epyc1: n = 27; WT: n = 27. ***P < 10−15, Student’s t test. (G) Representative images of anti-Rubisco immunogold labeling of WT and epyc1 cells grown at low CO2. Gold particles were enlarged 10× for visibility. (H) The fraction of immunogold particles outside the pyrenoid was quantified. WT: n = 26 cells, 8,123 gold particles; epyc1: n = 27 cells, 2,708 gold particles. ***P < 10−15, Student’s t test. In F and H, data are mean values, with error bars indicating SEM. Yellow arrows indicate pyrenoids. (Scale bars: 1 µm.)

