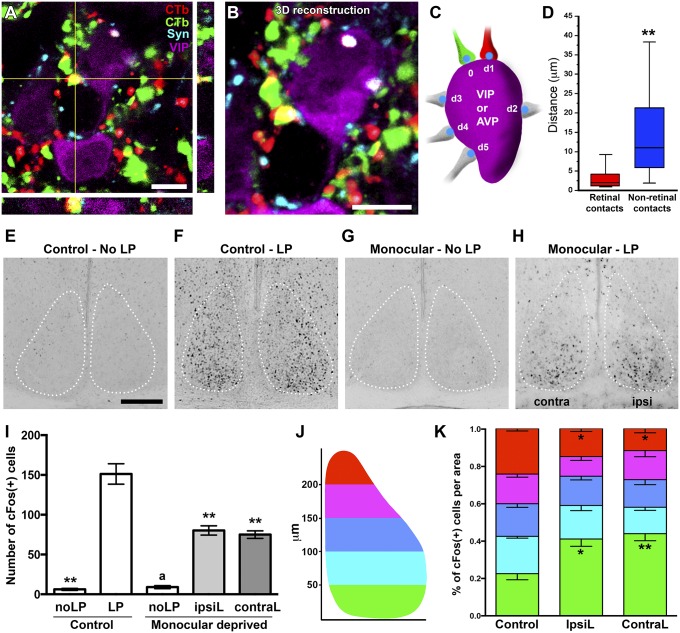
Fig. 5.
Bilateral retinal innervation to the SCN. A representative confocal image (A) and 3D reconstruction (B) showing VIP cell receiving innervation from both retinas (red CTβ from right eye and green CTβ from left eye). (C) The diagram for distribution analysis. (D) Retinal inputs displayed a particular pattern of innervation with both retinal synaptic contacts in close apposition. n = 15–20 cells, **P < 0.01, by Student’s t test. (E and F) c-Fos immunostaining of the SCN from mouse received no light (E) or a light pulse (1,000 lx) during the active phase (CT 14) (F). (G and H) In monocular-deprived mice, a similar light pulse stimulus still induced a sustained number of c-Fos+ cells. (I) Quantification of c-Fos+ cell number in the SCN from E–H. No significant differences were observed between the ipsilateral (IpsiL) and contralateral (ContraL) sides of the SCN in monocular-deprived mice. n = 5; **P < 0.001 vs. control-LP and aP < 0.001 vs. monocular-deprived mice (IpsiL and ContraL) by Tukey’s test. (J) The diagram for topographic distribution analysis. (K) Quantification of the c-Fos(+) cells topographic distribution in the SCN from control mice and the IpsiL or ContraL SCN regions from monocular-deprived mice. *P < 0.05 and **P < 0.001 vs. the control by Tukey’s test. [Scale bars: 5 μm (A and B); 100 μm (E).] Data are the mean ± SE.

