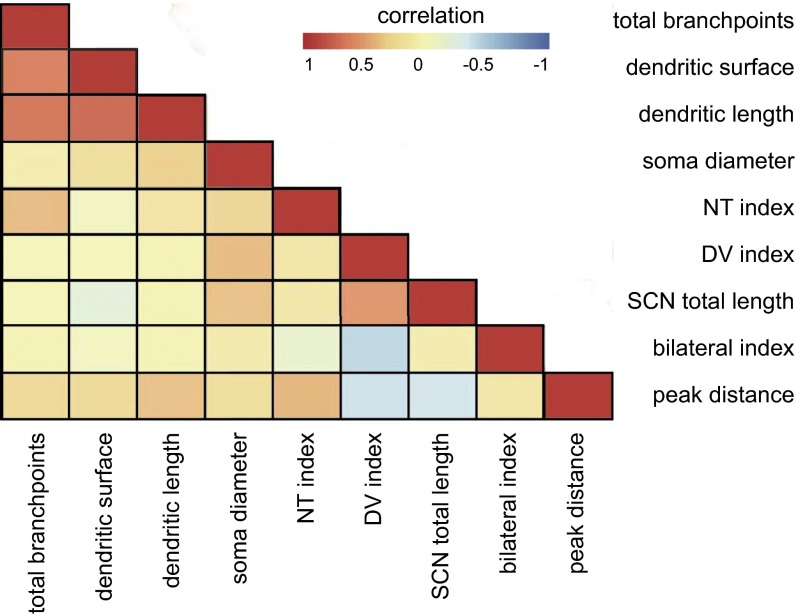
Fig. S8.
Dendritic-axonal correlation of ipRGCs. Heat map shows the correlation between all of the dendritic and axonal properties of ipRGCs. Red indicates strong positive correlation and blue indicates strong negative correlation. DV index: dorsal-ventral index; NT index: nasal-temporal index; peak distance: the distance of the peak intersection of axonal Scholl analysis in the SCN; SCN total length: total axonal length in the SCN; total branchpoints: total dendritic branchpoints.

