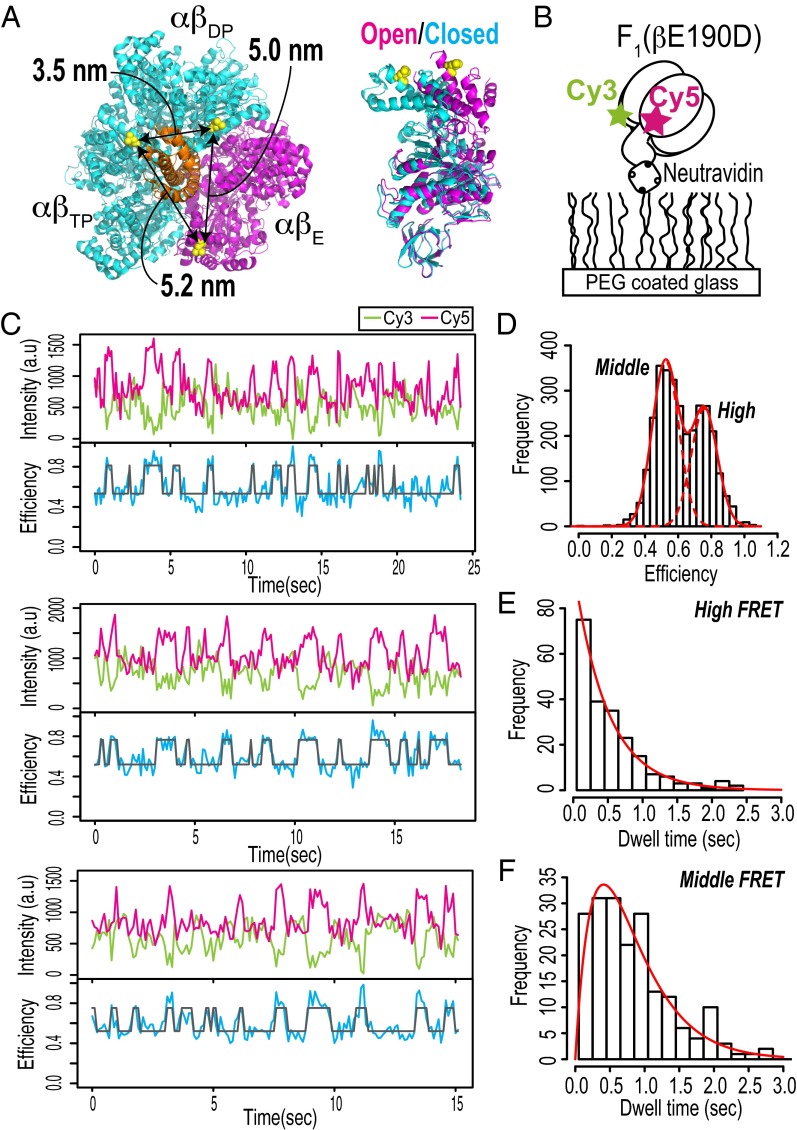
Fig. 1.
Single-molecule FRET measurements of F1. (A) Cysteine mutation sites for specific fluorescent labeling. The molecular structure is derived from bovine F1 [PDB ID code 2JDI (38)]. βL402s in the 2JDI structure, which correspond to βL398s in thermophilic F1, are shown as yellow spheres. (Right) The αβ-colors represent two distinct β-conformations: closed forms of βDP and βTP are shown in cyan, and an open form is shown in magenta; the γ-subunit is shown in orange. The distances between three Cβs of βL402 are indicated. (B) Schematic diagram of single-molecule FRET measurement. (C) Typical time trajectories of fluorescence intensities of Cy3 (donor; green) and Cy5 (acceptor; magenta) and FRET efficiency (blue). A two-state HMM fit to the FRET efficiency trace is shown in gray. The experiments were performed at 100 μM ATP. The recording rate was 10 frames per second. (D) Histogram of FRET efficiencies obtained from time series data (total of 19 molecules). The solid and dotted red lines represent a two-Gaussian fit (means of 0.52 and 0.76; variances of 0.0064 and 0.0064, respectively). (E and F) Histograms of dwell times in high and middle FRET states obtained from two-state HMM fits. The solid red lines in E and F are fits of (E) a single exponential for the high FRET state and (F) the convolution of two exponentials with same rate constant for the middle FRET state. The rate constants of the fits are 2.1 s−1 for the high FRET state and 2.4 s−1 for the middle FRET state.

