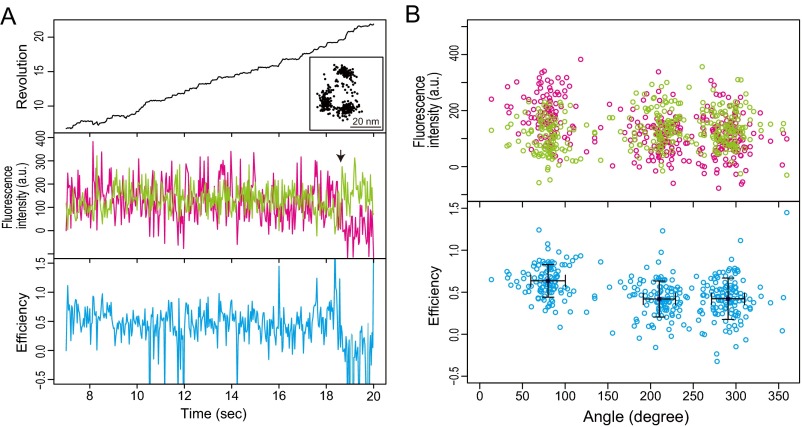
Fig. S3.
(A) Typical data from the experiment with F1-Cy3Cy5 at 1 mM ATPγS. The recording rate was 100 frames per second. Time trajectories of (Top) revolution of probe bead, (Middle) fluorescence intensities of Cy3 (green) and Cy5 (magenta), and (Bottom) FRET efficiency (blue) are shown. The trajectory of the probe bead in the sample plane is shown in A, Top, Inset. (A, Middle) The arrow indicates photobleaching of Cy5. The data are shown from the beginning of the fluorescence imaging after the bead imaging was started and stable rotation was confirmed. (B) Correlations between rotary angles and fluorescence intensities of Cy3 (green) and Cy5 (magenta) and FRET efficiency (blue) during FRET events before acceptor photobleaching in A. Error bars are SDs of each dwell.

