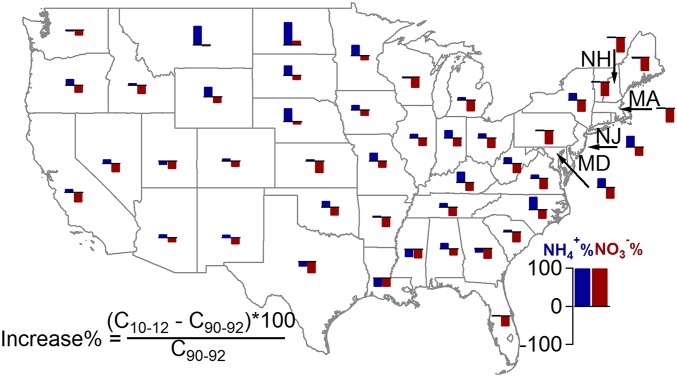
Fig. 2.
Absolute percentage change of NH4+ and NO3− in wet deposition across the country. C10–12 is the average NH4+ or NO3− flux (kg N/ha per year) in each state between 2010 and 2012 and C90–92 is the average NH4+ or NO3− flux (kg N/ha per year) between 1990 and 1992. Only sites in Fig. 1 with both 1990–1992 and 2010–2012 data available are used to calculate the average flux for each state.

