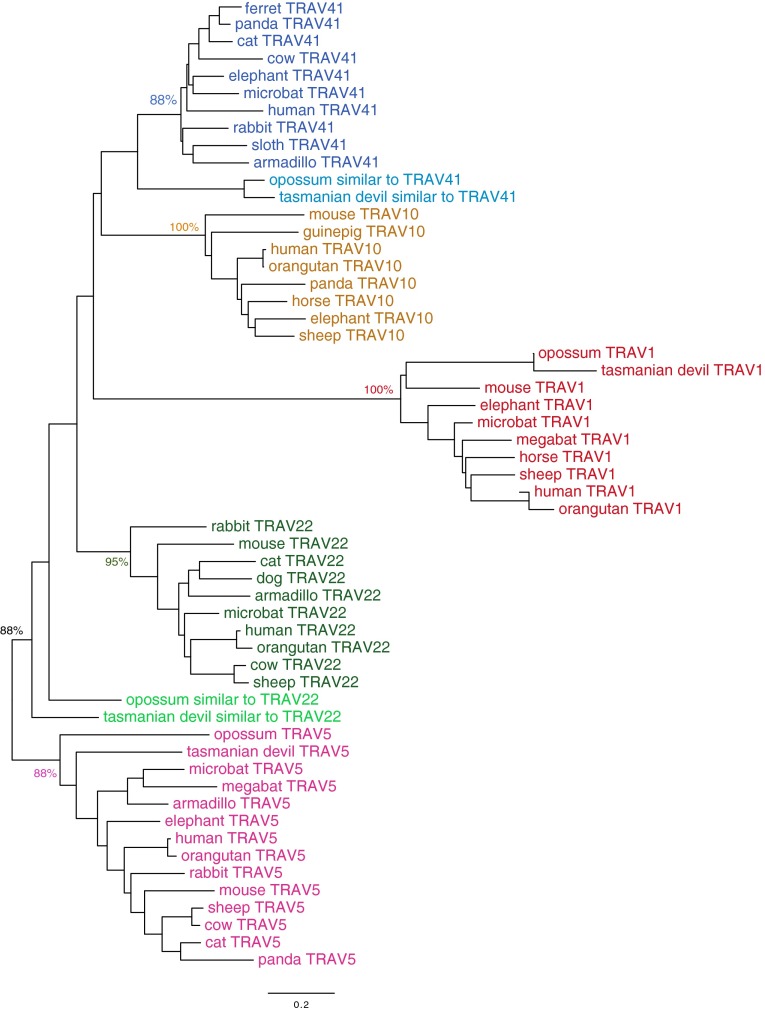
Fig. S2.
Distance (NJ) tree of TRAV1, TRAV5, TRAV10, TRAV22, and TRAV41 across mammals. TRAV sequences (Dataset S1) were aligned using ClustalW, and a NJ tree was computed using MEGA6 (NJ, bootstrap: n = 1,000; pairwise deletion). Key bootstrap values validating the TRAV groups (depicted in different colors) are shown.

