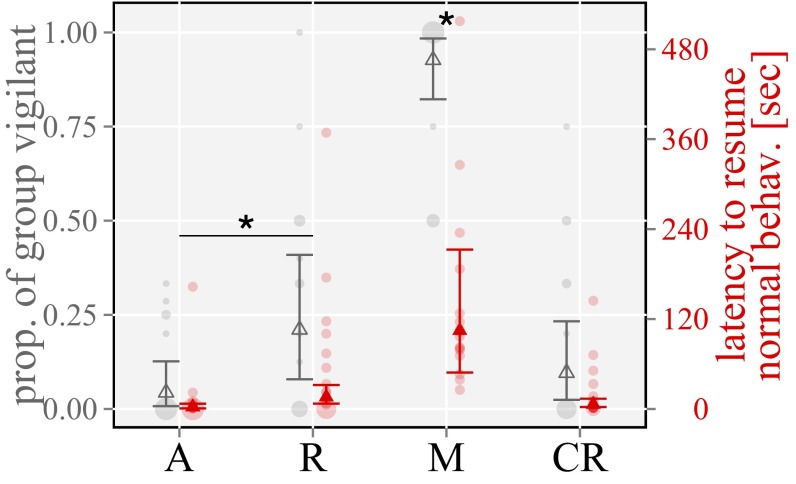
Fig. 2.
Proportion of group vigilant (gray) and latency to resume normal behavior of the first reacting bird (red). Playback treatments: A, alert calls; CR, chuck recruitment sequences; M, mobbing sequences; R, recruitment calls. Bars illustrate the 95% confidence intervals, and points show the median over 16 groups of the back-transformed data. Pale circles show the raw data. *Significant differences according to the 95% confidence intervals of the difference.

