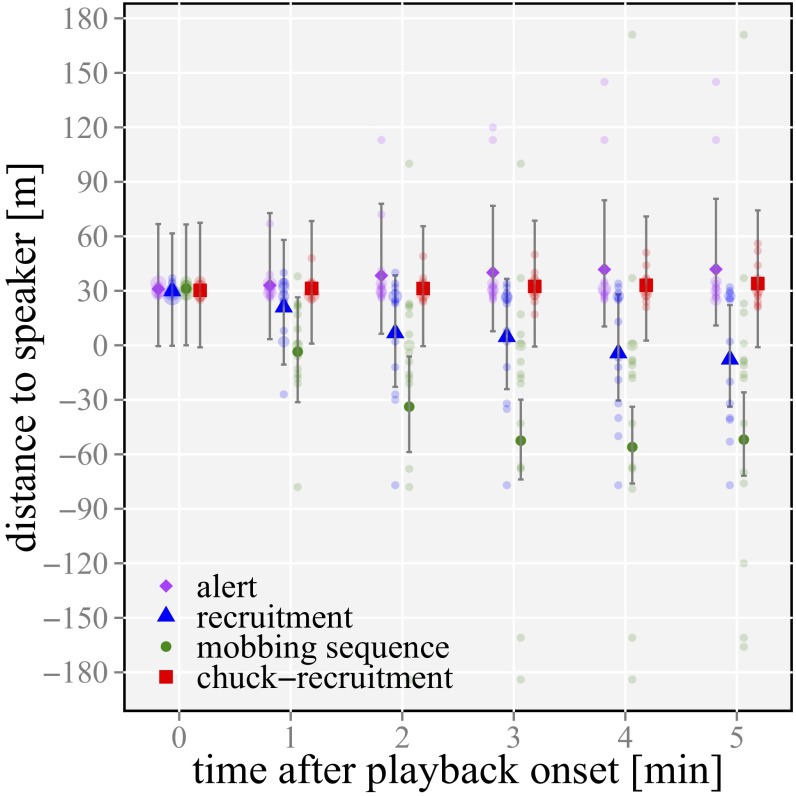
Fig. 3.
Group’s distance to the loudspeaker at the beginning and 1, 2, 3, 4, and 5 min after the playback start. Values over 30 m indicate a retreat from the loudspeaker. Negative values indicate that a group had passed the loudspeaker and continued moving in the same direction from where they originally heard the playback stimuli. Bars illustrate the 95% confidence intervals, and points show the median over 16 groups of the back-transformed data. Pale circles show the raw data.

