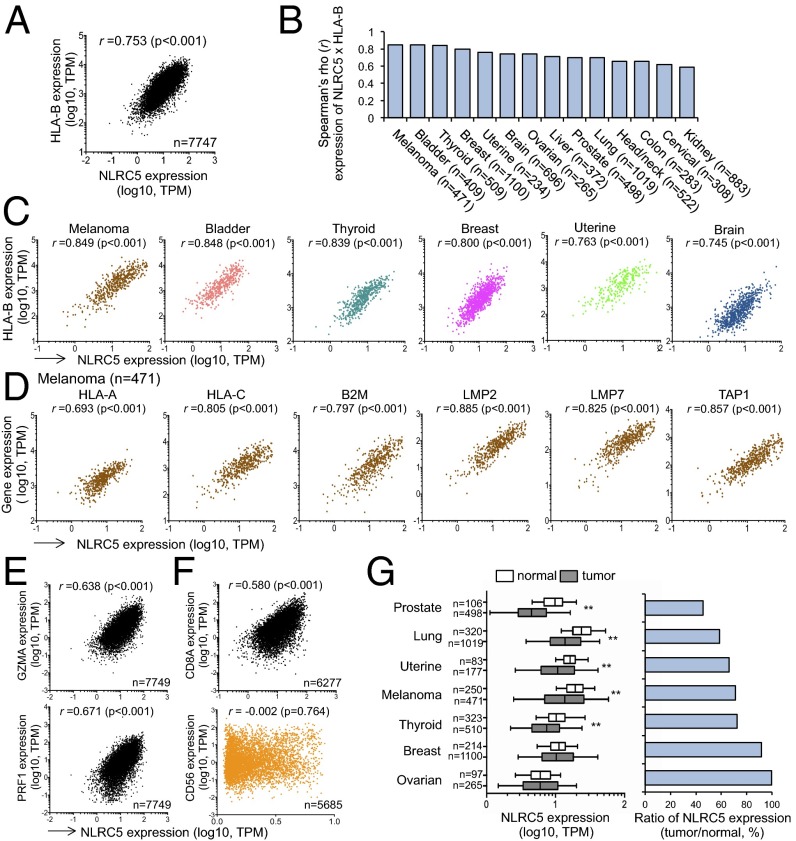
Fig. 1.
Expressions of NLRC5 and MHC class I genes are positively correlated. (A) Scatter plots for the expression of NLRC5 [x axis; log10 values in transcripts per million (TPM)] and HLA-B (y axis; log10 values in TPM) in 16 tumor types (n = 7,747). (B) Spearman rank correlation coefficients between the expression of NLRC5 and HLA-B. Fourteen representative tumor types carrying at least 100 samples are shown. (C) Scatter plots for the expression of NLRC5 and HLA-B in six tumor types showing high correlation coefficients. (D) Scatter plots for the expression of NLRC5 and other MHC class I-related genes in melanoma that have the highest correlation coefficients in B. (E) Scatter plots for the expression of NLRC5 and GZMA or PRF1 in 16 tumor types (n = 7,749). (F) Scatter plots for the expression of NLRC5 and CD8A in 16 tumor types (n = 6,277) or CD56 in 15 tumor types (n = 5,685). Pairwise correlations in A–F were calculated using the Spearman’s ranked correlation test; r, Spearman rho coefficient. (G, Left) NLRC5 expression in indicated normal and tumor tissues. The bar inside the box corresponds to the median; the box corresponds to the 25th–75th percentiles, and the error bars indicate the confidence interval (fifth–95th percentile). Statistical significance was determined by the Mann–Whitney test: **P < 0.01. (Right) The ratio of NLRC5 expression level in tumor and normal tissues.

