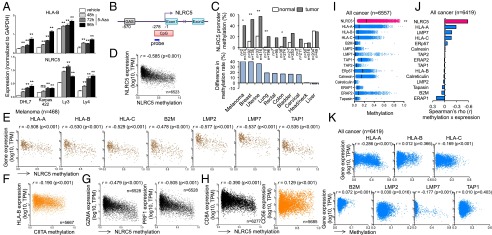
Fig. 2.
Preferential DNA methylation in the NLRC5 promoter in cancer cells is associated with impaired MHC class I-dependent cytotoxic T-cell activity. (A) Indicated cancer cell lines were treated with 3 μM of 5-Aza for the indicated time periods, and NLRC5 and HLA-B expression was quantified by quantitative PCR. Data are representative of three independent experiments and are shown as means ± SD. Statistical significance was determined by the paired t test: **P < 0.01. (B) Schematic representation of the methylation-specific probe on the NLRC5 promoter region. The NLRC5 promoter has a CpG island of ∼578 bp starting at position −278. To examine the methylation status of the NLRC5 promoter, a methylation-specific probe (cg16411857, blue line) on the CpG island was used. The transcription start site is indicated as −1; the STAT1-binding site GAS is at −570. (C, Upper) The methylation rate of the NLRC5 promoter in 10 indicated cancer types and normal tissues. (Lower) The difference in the NLRC5 promoter methylation rate in tumor and normal tissues. A β value over 0.3 was considered as methylated. Statistical significance was determined by the χ2 test: *P < 0.05; **P < 0.01. (D) Scatter plots showing the expression of NLRC5 (y axis; log10 values in TPM) and the methylation level of the NLRC5 promoter (x axis; β values) in 15 tumor types (n = 6,523). (E) Scatter plots for the expression of various MHC class I-related genes and the methylation level of the NLRC5 promoter in melanoma (n = 468). (F) Scatter plots for HLA-B expression and methylation level of CIITA promoter in 15 tumor types (n = 5,667). (G) Scatter plots for the expression of GZMA or PRF1 and the methylation level of the NLRC5 promoter in 15 tumor types (n = 6,528). (H) Scatter plots for CD8A expression in 15 tumor types (n = 6,277) or CD56 expression and methylation level of the NLRC5 promoter in 14 tumor types (n = 5,685). (I) Dot plots for the methylation level of various MHC class I-related genes (x axis; β values) in all cancer types (16 tumor types, n = 6,557). The median values are indicated by vertical bars. Statistical significance was determined by the Mann–Whitney test: **P < 0.01. (J) Spearman rank correlation coefficient between the expression and methylation of indicated MHC class I-related genes in 15 tumor types (n = 6,419). (K) Scatter plots for the expression and methylation level of various MHC class I-related genes in 15 tumor types (n = 6,419). In D–H, J, and K pairwise correlations were calculated using the Spearman’s ranked correlation test. r, Spearman rho coefficient.

