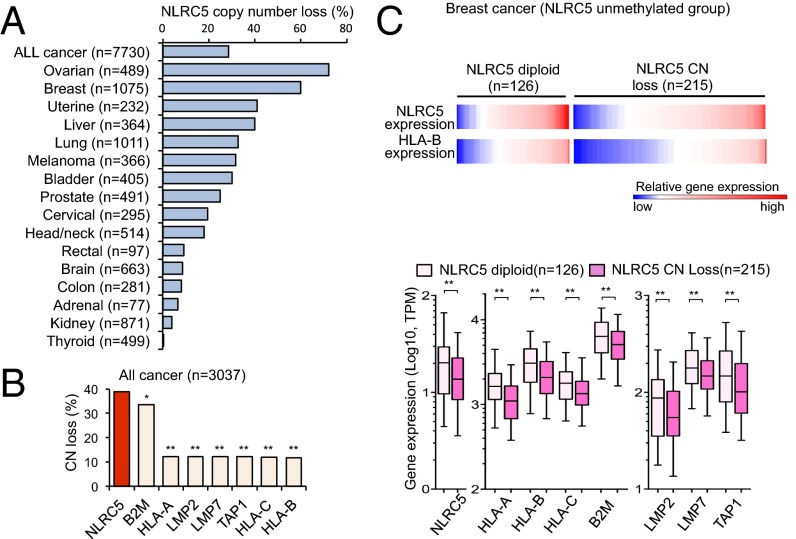
Fig. 3.
CN loss in NLRC5 is associated with reduced expression of MHC class I genes. (A) Percentage of cancer patients who carry NLRC5 CN loss among 16 tumor types. Based on GISTIC values, samples were classified into the NLRC5 diploid group (GISTIC 0) and the CN-loss group (GISTIC −1 and −2). (B) Percentage of cancer patients who carry CN loss of various MHC class I-related genes for nine tumor types for which data are available (bladder, breast, colon, head/neck, lung, ovarian, prostate, rectal, and uterine cancer). Statistical significance was determined by the χ2 test: *P < 0.01; **P < 0.0001. (C) Heatmap showing gene expression of NLRC5 and HLA-B in the NLRC5 diploid group (n = 126) and in the CN-loss group (n = 215) for breast cancer patients in which the NLRC5 promoter is not methylated (β values <0.3). The box plots show NLRC5 and MHC class I-related gene expression in the NLRC5 diploid group or in the CN-loss group in breast cancer. The bar inside the box corresponds to the median, the box corresponds to the 25th–75th percentile, and the error bars indicate the confidence interval (fifth–95th percentile). Statistical significance was determined by the Mann–Whitney test: **P < 0.01.

