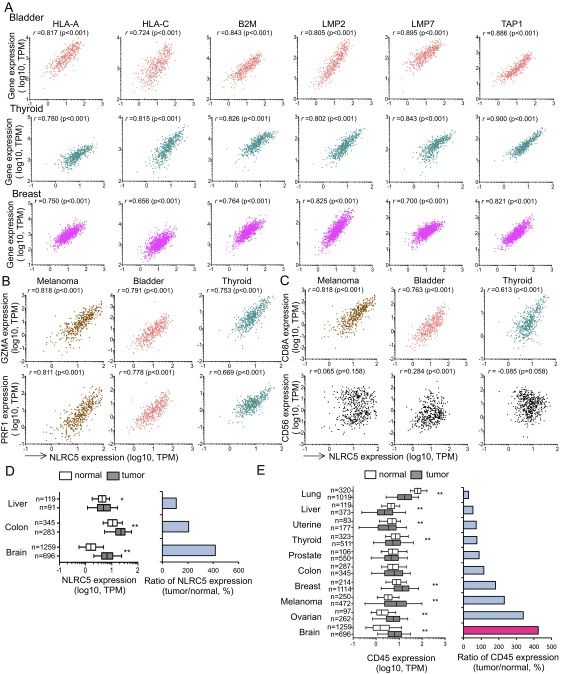
Fig. S1.
Expression of NLRC5 and MHC class I genes is positively correlated. (A) Scatter plots for the expression of NLRC5 (x axis; log10 values in TPM) and other MHC class I-related genes (y axis; log10 values in TPM) in biopsy samples from patients with bladder cancer (Top Row), thyroid cancer (Middle Row), and breast cancer (Bottom Row). (B) Scatter plots for the expression of NLRC5 and GZMA (Upper Row) or PRF1 (Lower Row) for the three indicated tumor types. (C) Scatter plots for the expression of NLRC5 and CD8A (Upper Row) or CD56 (Lower Row) for the three indicated tumor types. (D, Left) NLRC5 expression in normal and tumor tissues. (Right) The ratio of NLRC5 expression level in tumor and normal tissue. (E, Left) CD45 expression in normal and tumor tissues. (Right) The ratio of CD45 expression level in tumor and normal tissue. In A–C pairwise correlations were calculated using the Spearman’s ranked correlation test. r, Spearman rho coefficient. In D and E the bar inside the box corresponds to the median, the box represents the 25th–75th percentile and the error bars indicate the confidence interval (fifth–95th percentile). Statistical significance was determined by the Mann–Whitney test: *P < 0.05; **P < 0.01.

