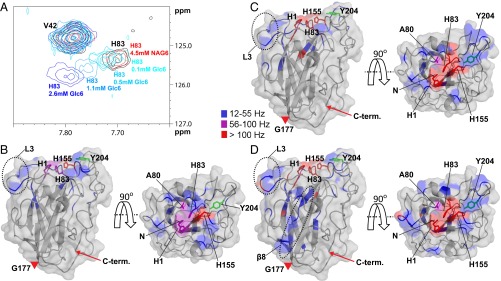
Fig. 1.
Interaction of apo-NcLPMO9C with substrates. (A) Overlay of an area of interest from the 15N-HSQC spectrum for NcLPMO9C (black) in the presence of 4.5 mM GlcNAc6 (labeled as NAG6; red) or increasing concentrations of Glc6 (from lighter to darker blue). The HN/N chemical shift of Val42 is not affected by the interaction, and therefore, the peak is shown as a reference. (B–D) Compound change in chemical shifts larger than 12 Hz (Fig. S3) upon substrate binding mapped on the structure of NcLPMO9C. The backbone of NcLPMO9C (shown in cartoon and surface representation) is colored according to the compound change in chemical shift (15N-HSQC) upon adding 2.6 mM Glc6 (B), 1.3 mM XG14 (C), or 4.2 µM polyXG (D) using the indicated coloring scheme (gray coloring represents no change). The NcLPMO9C structure is shown by a side view (Left) and a top view (Right). The side chains of residues His1, Ala80, His83, and His155 are shown in stick representation. In addition, the side chain of Tyr204 is shown in green. The positions of the L3 loop and the β8-strand are marked on the structures. The LC loop spans the stretch from Gly177 (marked with a red triangle) to the C terminus (marked with a red arrow). The N-terminal amino group (His1) is not observed in 15N-HSQC spectra because of its fast exchange. The 13C-aromatic HSQC spectra showed clear changes in chemical shift for this residue, with all three substrates, with the strongest effects (a vanished signal) being observed with XG14 and polyXG. Based on these observations, for illustrative purposes, His-1 is colored purple (B) or red (C and D) in the figures.

