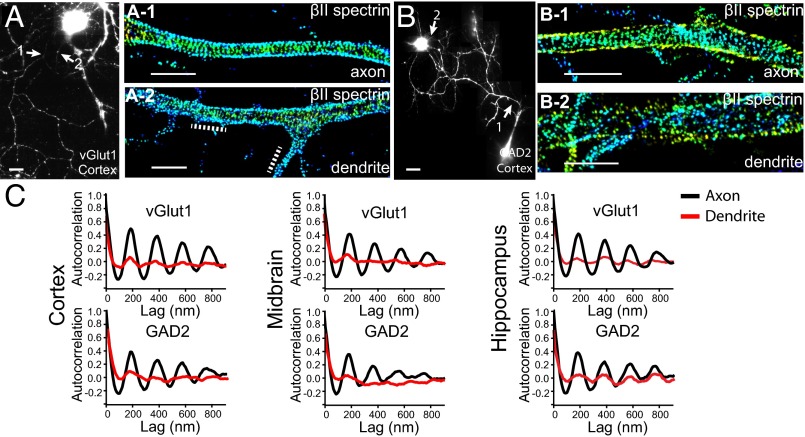
Fig. 1.
The MPS structure is present in both excitatory and inhibitory neurons from mouse cortex, midbrain, and hippocampus. Cultured neurons were immunostained with vGlut1 or GAD2 to label the excitatory and inhibitory neurons, respectively. (A) Reconstructed conventional image of a vGlut1+ cortical neuron shown together with 3D STORM images of βII spectrin in an axonal (A-1) and dendritic (A-2) region. The axonal (A-1) and dendritic (A-2) regions correspond to the regions indicated by arrows in A. Dotted lines in A-2 indicate patches of periodic pattern in the dendritic shaft. In 3D STORM images, localizations at different z values are depicted in different colors. (B, B-1, and B-2) Similar to A, A-1, and A-2 but for a GAD2+ cortical neuron. (C) Averaged autocorrelation functions calculated from multiple, randomly selected axonal (black) and dendritic (red) regions in neurons cultured from cortex (n = 18 for axons and n = 9 for dendrites of GAD2+ neurons; n = 9 for axons and n = 8 for dendrites of vGlut1+ neurons), midbrain (n = 8 for axons and n = 7 for dendrites of GAD2+ neurons; n = 13 for axons and n = 11 for dendrites of vGlut1+ neurons), and hippocampus (n = 6 for axons and n = 8 for dendrites of GAD2+ neurons; n = 8 for axons and n = 9 for dendrites of vGlut1+ neurons), respectively. (Scale bar: 20 µm for conventional images and 2 µm for STORM images.)

