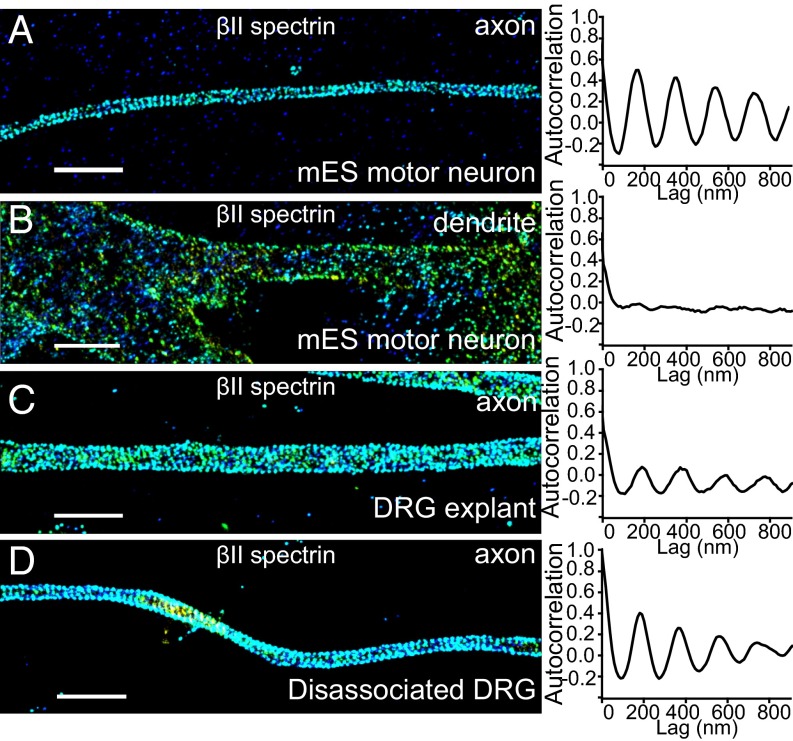
Fig. 3.
MPS is present in mouse peripheral sensory and motor axons. (A) Representative STORM images of βII spectrin for a typical axonal region (Left) and averaged autocorrelation functions from multiple axons (Right, n = 12) for mES-derived motor neurons. (B) Same as in A but for dendrites in mES-derived motor neurons (n = 11). (C and D) Same as A but for axons in DRG neurons (C, explants, n = 13; D, dissociated DRG culture, n = 10). (Scale bar: 2 µm.)

