Fig. 5.
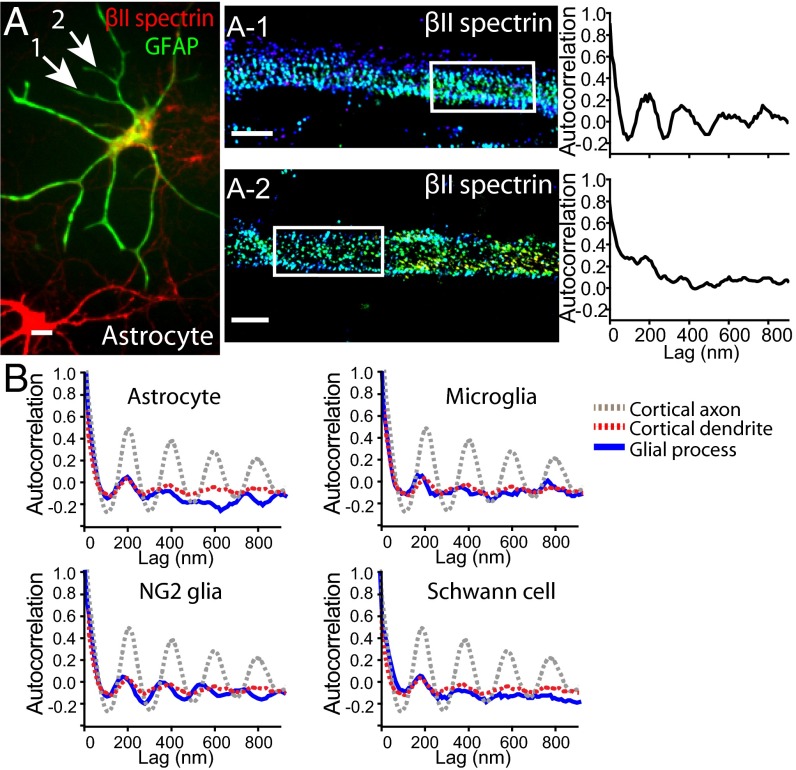
Sparse presence of the periodic βII spectrin structure in glial cell processes. (A) An astrocyte stained for the astrocyte marker GFAP (green) and βII spectrin (red). (A-1 and A-2) STORM images of βII spectrin from two processes of that astrocyte (indicated by arrows) displaying relatively periodic (A-1) or irregular (A-2) spectrin distribution. (Right panels) Autocorrelation analysis of the boxed regions. (B) Averaged autocorrelation functions (blue) calculated from multiple randomly selected processes of astrocytes, microglia cells, NG2 glia, and Schwann cells (n = 10 for astrocytes, n = 9 for microglia, n = 8 for NG2 glia, n = 9 for Schwann cells). For comparison, the dotted gray and red curves show the averaged autocorrelation functions of βII spectrin distribution in axons and dendrites of cortical vGlut1+ neurons, respectively (reproduced from Fig. 1C). (Scale bar: 20 µm for conventional image and 1 µm for STORM images.)

