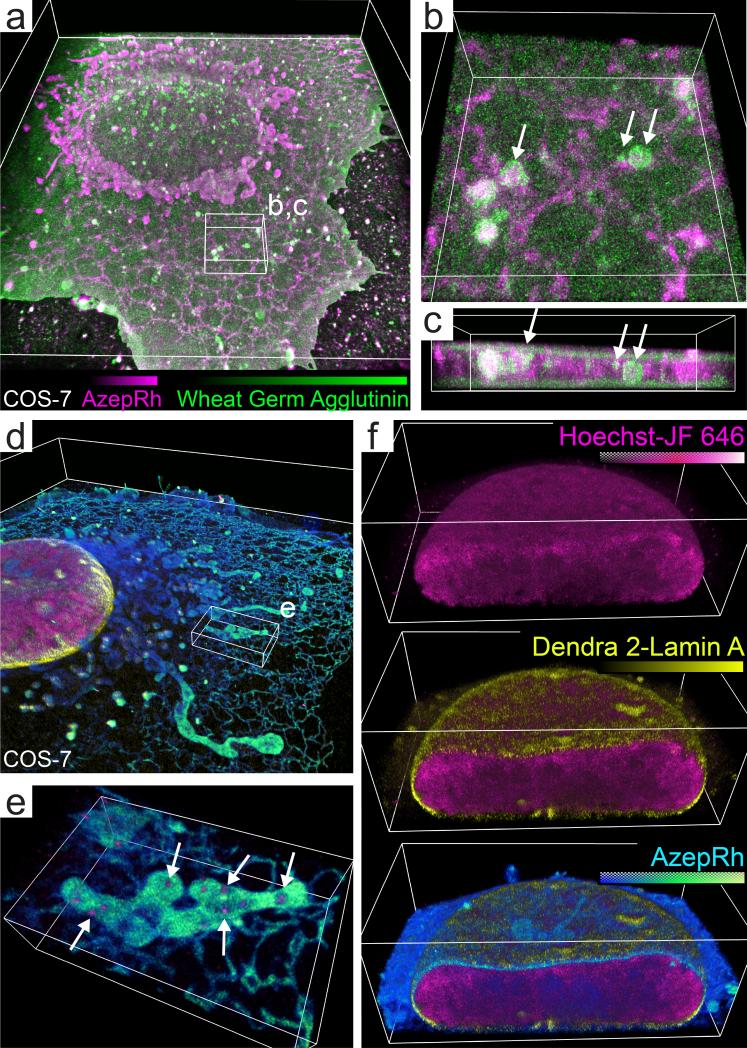
Fig. 3. Multicolor lattice light sheet – PAINT microscopy.
(a) Volume rendering of a COS-7 cell that has been sequentially imaged with AzepRh and wheat germ agglutinin – Alexafluor 555 to label intracellular and plasma membranes respectively. (b-c) Magnified perspective and orthogonal view of the region outlined in (a). White arrows indicate internalized vesicles adjacent to the endoplasmic reticulum yet peripherally stained with wheat germ agglutinin. (d) Three color PALM/PAINT imaging of DNA (Hoechst – JF646, PAINT, magenta), the nuclear envelope (Dendra 2 – lamin A, PALM, yellow), and intracellular membranes (AzepRh, PAINT, cyan) in a COS-7 cell. (e) Magnified perspective view of the region outlined in (d). White arrows highlight mitochondrial DNA nucleoids. (f) Cutaway views oriented perpendicular to the s axis through the nucleus in (d). Bounding boxes are 50 × 60 × 6.5 μm (a), 6 × 6 × 2.1 μm (b), 6 × 2.6 × 1.5 μm (c), 60 × 60 × 7.5 μm (d), 7 × 4.4 × 1.6 μm (e), and 21.7 × 13 × 7.5 μm (f). See also Supplementary Videos 5-8.

