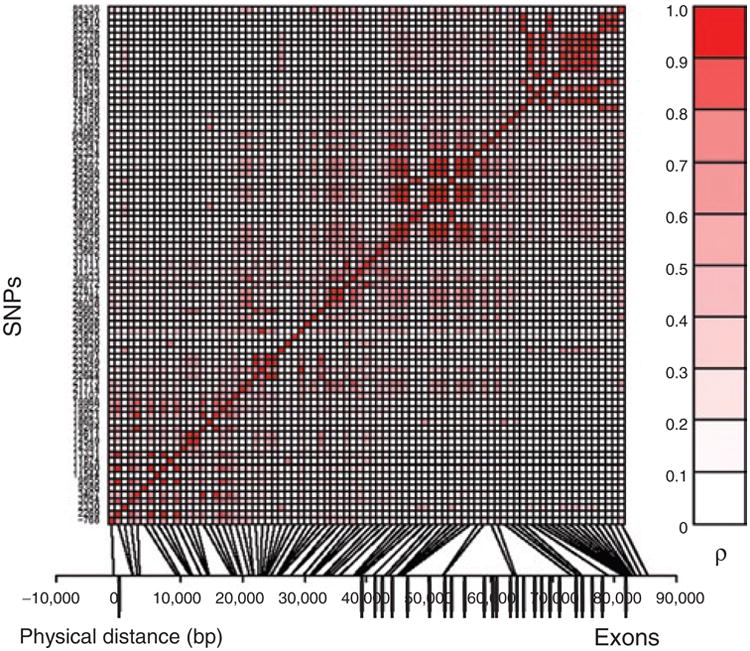
Figure 1.

SNP linkage disequilibrium structure within ENPP1. SNPs are indicated by their physical order within the gene on the y-axis. The relative positions of the SNPs are indicated on the x-axis. Physical distance is denoted in bp. The degree of correlation (ρ) between SNP pairs is indicated by the intensity of shading in the small squares of the central figure, with perfect correlation between identical SNPs along the diagonal. Gene exonic structure is indicated by the vertical bars below the x-axis. A total of 79 SNPs are shown, including seven SNPs which were not in Hardy–Weinberg equilibrium.
