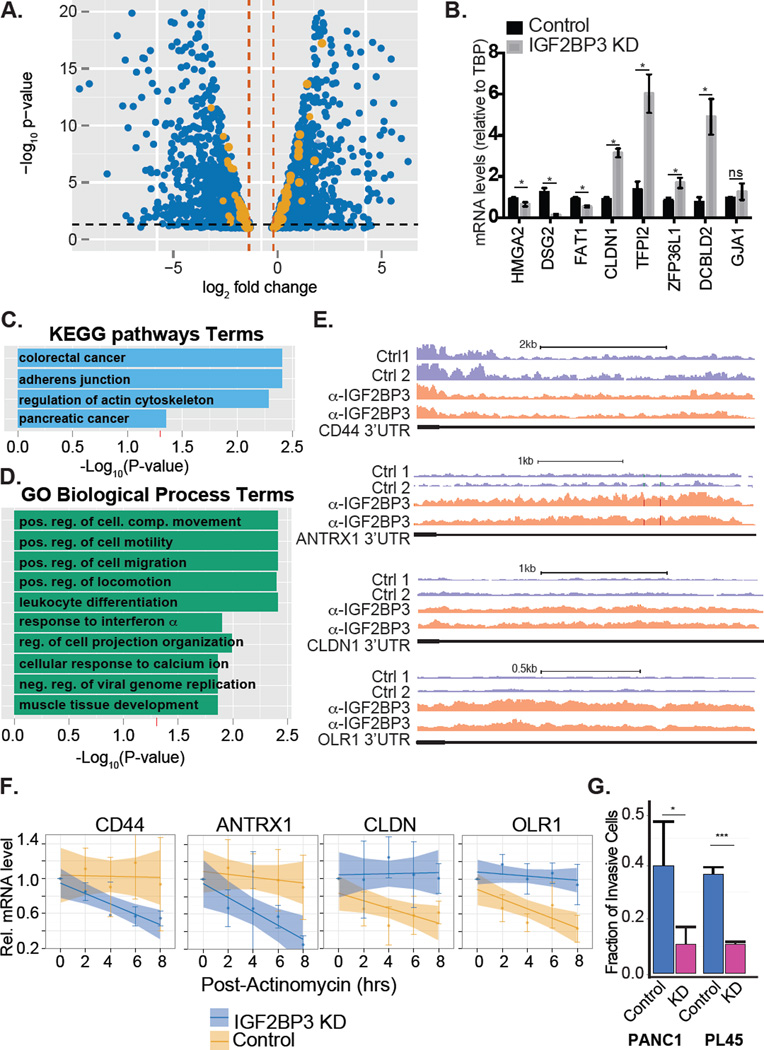
Figure 1. IGF2BP3 regulates transcripts associated with cancer pathways.
A. Volcano plot depicting differentially expressed genes from both PANC1 and PL45 (blue dots) and those mRNAs bound by IGF2BP3 (orange dots). B. Bar graph showing relative quantification of mRNA levels in IGF2BP3-depleted or control PANC1 cells. C. KEGG pathway enrichment analysis of differentially expressed-IGF2BP3 bound mRNAs (orange dots from panel A). D. Gene ontology enrichment analysis of differentially expressed-IGF2BP3 bound mRNAs. E. Genome Browser snapshots of read coverage from replicate RIP-seq experiments from PL45 cells for CD44 and CLDN1 3’UTR (top and bottom panel, respectively). F. Relative quantification RT-qPCR analysis of CD44 and CLDN1 mRNA stability in control or IGF2BP3-depleted PL45 cells. G. Bar graph quantifying the invasiveness of control or IGF2BP3-depleted PANC1 or PL45 cells through matrigel filters relative to control filters. The bars represent an average of three independent experiments. Error bars correspond to standard deviation. Statistical significance estimated using unpaired T-test, *** P<0.001, * P<0.05.

