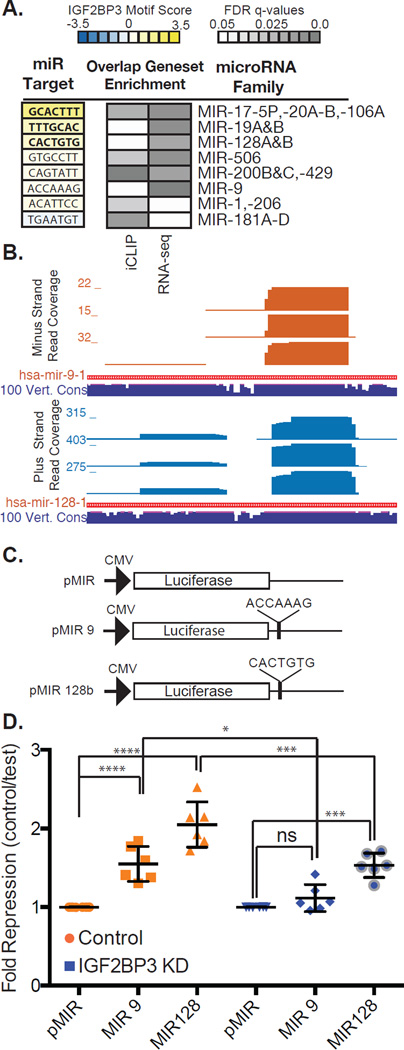
Figure 3. IGF2BP3 modulates expression of miRNA-regulated transcripts.
A. Examples of miRNA families with significant sequence similarity between their target site and the IGF2BP3 consensus motif (left panel). Enrichment of miRNA target sites in 3’UTRs identified by iCLIP and by RNA-Seq analysis of control or IGF2BP3-depleted PANC1 cells. B. UCSC genome browser screen shots showing read coverage across miRNA-9 and -128 loci (upper and lower panel, respectively). Histogram shows number of reads at each position. Sequence conservation across 100 vertebrate genomes (navy blue track). C. Schematic diagram of luciferase reporter plasmids. D. Scatter plot showing normalized luciferase reporter expression (fold repression) in control cells (orange) and IGF2BP3-depleted cells (blue).

