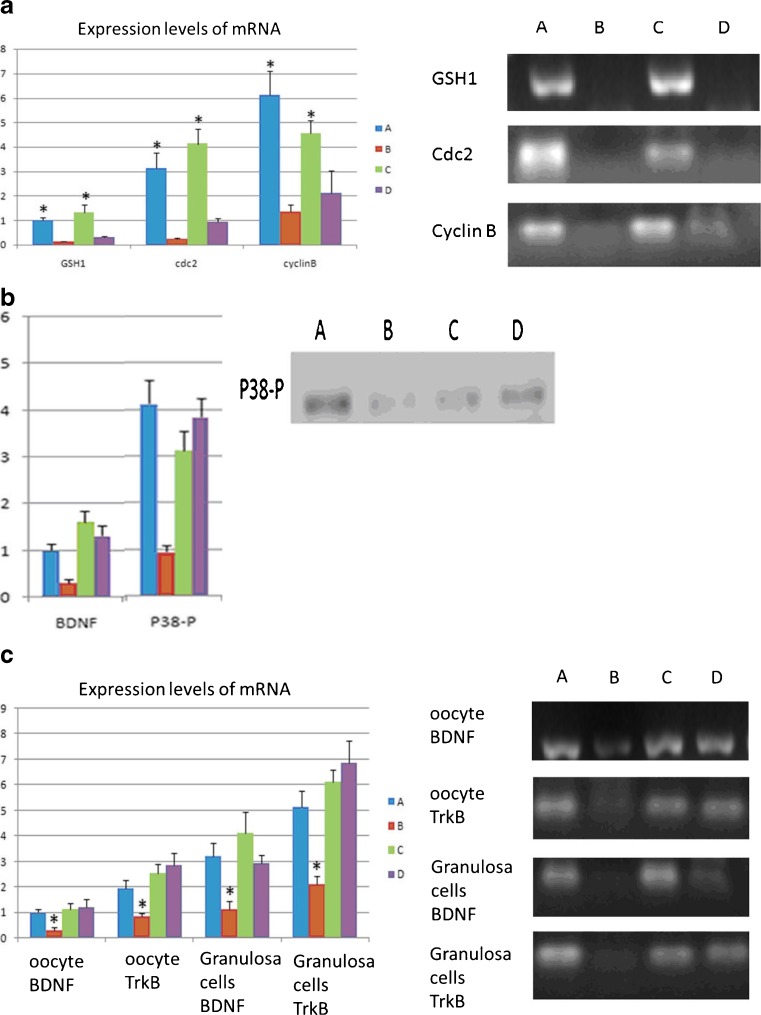
Fig. 5.
a BSTCR and DHEA both attenuated the depletion of GSH1, cyclin B, and CDC2 levels induced by cyclophosphamide in oocytes, as shown in mRNA level. b In the DOR group, the protein expression level of phosphorylated P38 level (41 kDa) in oocytes was down-regulated compared with the control group, as shown in Western blot. But BSTCR and DHEA both reversed these changes by cyclophosphamide. c mRNA expression levels of BDNF and its binding receptor TrkB both reduced in the oocytes and granulosa under DOR background. BSTCR and DHEA both rescued these alterations. All Y-axis indicates relative reading from 2−ΔΔCt calculation. Blue column (a) indicates control cells, while brown column (b) represents cells with cyclophosphamide treatment; light green column (c) indicates cells with BSTCR treatment, while purple column (d) represents cells with DHEA treatments. *P < 0.05

