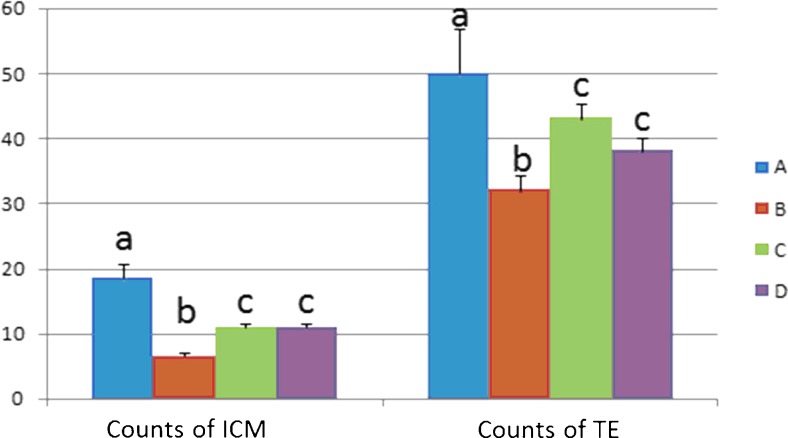
Fig. 6.
Inner cell mass and trophoblasts in the blastula after IVF both reduced in number in the DOR group compared to the other three groups. Blue column (a) indicates control cells, while brown column (b) represents cells with cyclophosphamide treatment; light green column (c) indicates cells with BSTCR treatment, while purple column (d) represents cells with DHEA treatments. The Y-axis stands for the number of actual count of cells of either inner cell mass or in trophoblasts

