Fig. 1.
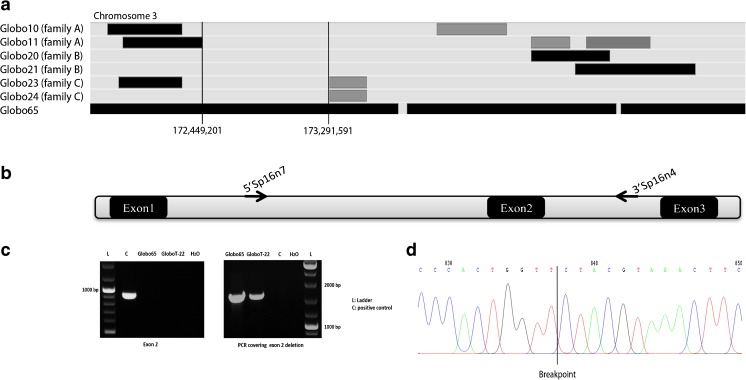
Analysis of SPATA16 gene. a SNP array results of the four infertile patients for the region of chromosome 3. Shared regions of homozygosity are visualized by the HomoSNP software, which displays one patient per line. The areas of homozygosity with 25 or more SNPs are black, whereas homozygosity regions defined by 15–25 consecutive SNPs are grey. Regions of heterozygosity are light grey. Globo65 shows a homozygous region for SPATA16 locus (Loc. Chr3:172, 889,358–173,141,268) which is not shared by the brothers of the three families, Globo10/11, Globo20/21 and Globo23/24. b Schematic representation of exons 1, 2 and 3 of SPATA16. Sequence amplifications on both sides of exon 2 were performed using the primers 5′SPA16n7 at 2500 bp from exon1 and 3′SP16n4 at 2274 bp from exon 2 in order to determine the breakpoints of the deletion. c PCR results of SPATA16 exon 2 and breakpoints. The patients are deleted for exon 2 while the positive control showed amplification. The PCR covering the deletion of exon 2 was performed using the primers 5′SPA16n7 and 3′SP16n4. The deleted patients showed a fragment of 2000 bp while the positive control was homozygous wild type since no fragment was amplified. d Sequence of the PCR covering the deletion in the patients, allowing the identification of the breakpoint

