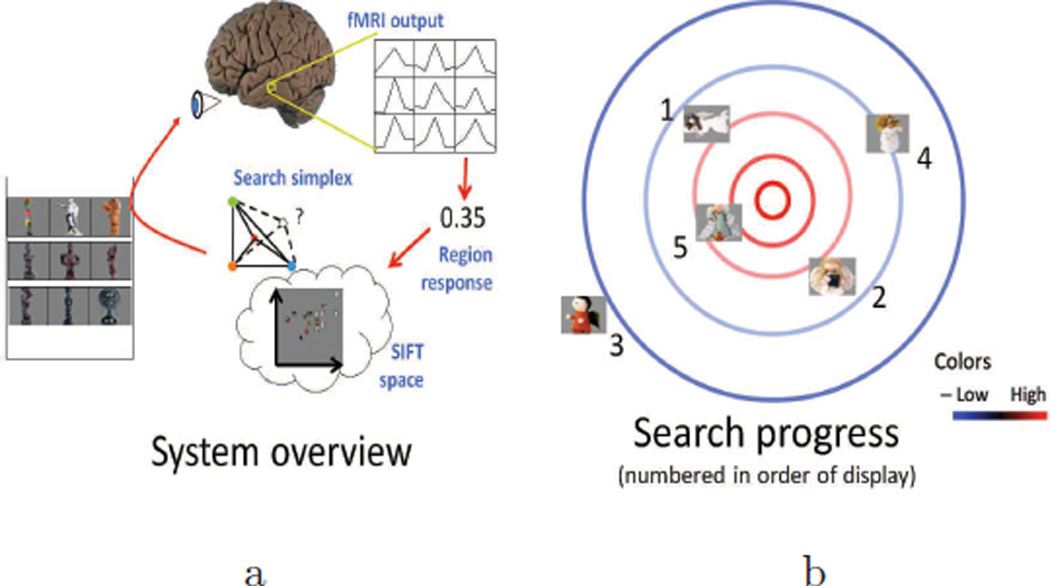
Figure 1.
(a) Schematic of loop from stimulus display to measurement and extraction of cortical region response to selection of next stimulus. (b) Example progression of desired stimulus search. Cortical response is highest towards the center of the space (red contours) and lowest towards the edges of the space (blue contours). Stimuli displayed in order listed. Cortical responses to initial stimuli, e.g., those numbered 1, 2, and 3, influence selection of further stimuli closer to maximal response region in visual space, e.g., those numbered 4 and 5. Figure adapted from Fig. 1 in Leeds et al. (2014)

