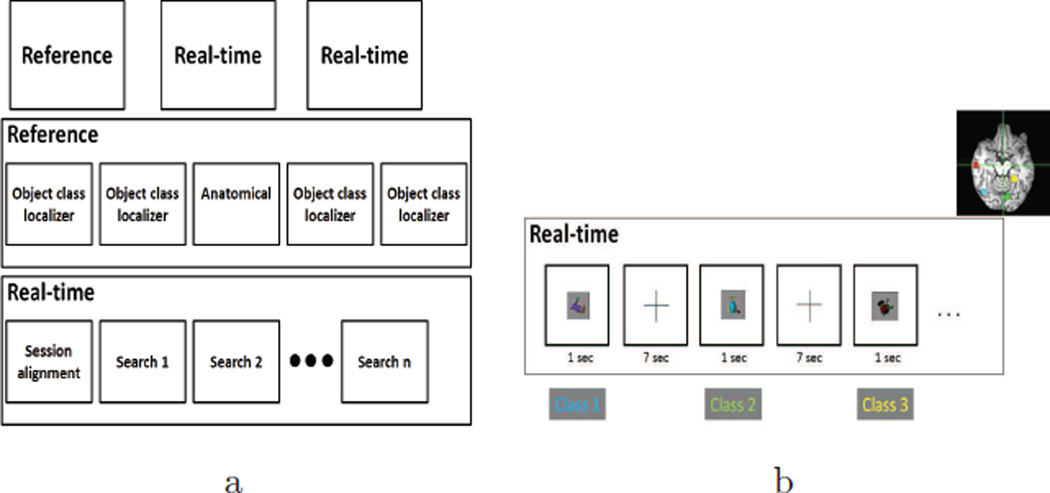
Figure 3.
(a) Structure of the three scanning sessions performed for each subject. First row depicts the three sessions, second row depicts the runs for the reference session, and third row depicts the runs for each real-time session. (b) An example of the alternation among four stimulus class searches in a real-time search run. These four classes are comprised of mammals, human-forms, cars, and containers, and correspond to four colored brain regions shown on the upper-right of the figure. Figure adapted from Fig. 2 in Leeds et al. (2014).

