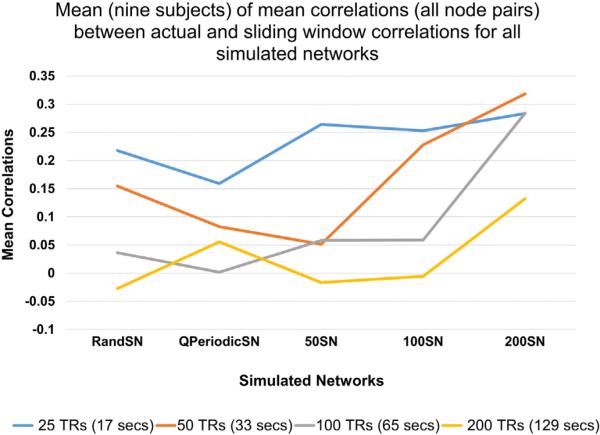
Fig. 4.
Mean of mean correlations (of all node pairs) over all subjects. The overall mean is not very high because the SWC is very sensitive to abrupt transitions between the states. However, smaller windows give SWC results that are more similar to the actual correlation values compared to larger windows.

