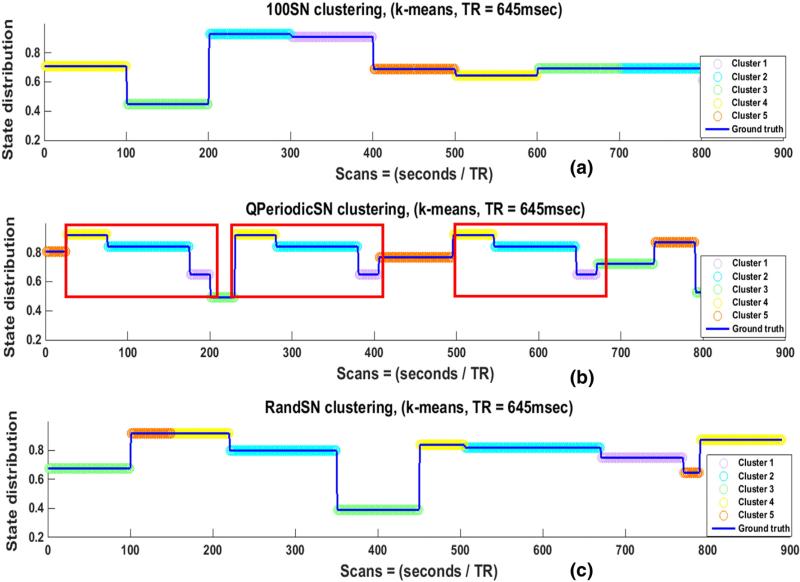
Fig. 6.
Clustering of raw SNs (100SN in (a), QPeriodicSN in (b), and RandSN in (c)) using k-means. The best number of clusters was identified using Silhouette criteria. Discontinuities in the blue lines indicate state transition points, while the colors of the overlaid circles represent the Cstate at each time point that was assigned by the clustering algorithm (k-means). When the circles between two adjacent state transition points remain the same color, it indicates that the state is correctly identified to be in single Cstate and a color change at state transition points indicates that the state transitions are correctly identified. The division of the raw signals gives perfect state transitions and state durations. The repeated states of QPeriodicSN (red rectangles) are assigned to the same Cstates, as expected.

