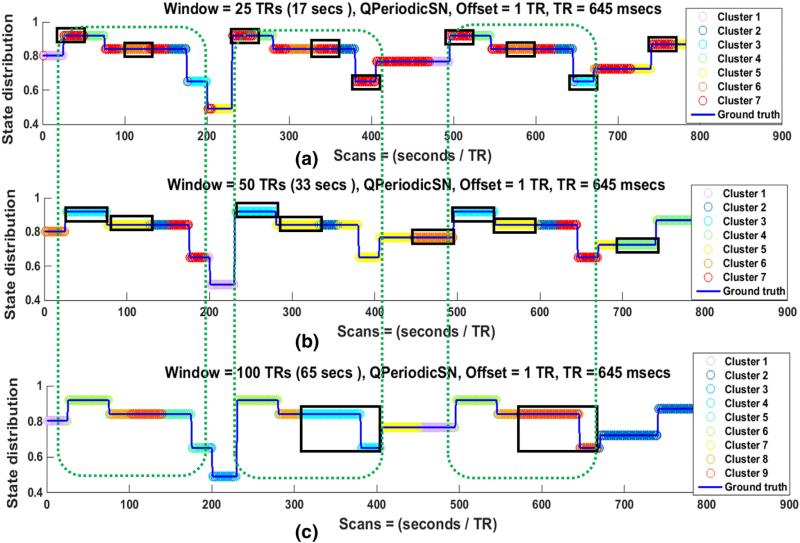
Fig. 8.
State distribution of QPeriodicSN for (a) 25 TRs, (b) 50 TRs, and (c) 100 TRs windows in one subject. Discontinuities in the blue lines indicate that state transition points and the colors of the overlaid circles represent the Cstate at each time point that was assigned by the clustering algorithm (k-means). When the circles between two adjacent state transition points remain the same color, it indicates that the state is correctly identified to be in single Cstate, while a color change at transition points indicates that the state transitions are correctly identified. The 25TRs window is able to capture the state transitions accurately than the larger windows in (a) but the number of overall state transitions in this case is also larger than for the 50TRs or 100TRs windows in (b) and (c). The quasi periodic pattern of the SN is identified in 25 TRs and 50 TRs windows as shown by the same color distributions inside the green dotted rectangles. Furthermore, the state identification is dominated by the size of the window since most of the state durations are almost equal to the window size as shown by black rectangles.

