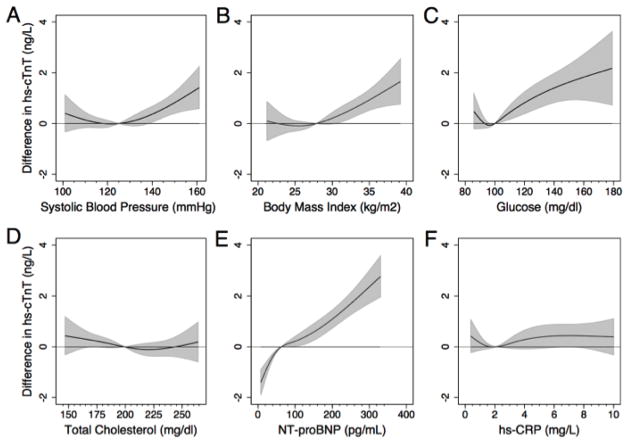
Figure 2.
Restricted cubic spline models of the continuous association of selected cardiovascular risk factors with hs-cTnT levels.
The figures are centered at the median value of the cardiovascular risk factor on the X-axis. The shaded area represents the 95% confidence interval from the restricted-cubic-spline model. The plot was truncated at the 2.5th and 97.5th percentile of the risk factor on the X-axis (for hs-CRP truncated at values greater than 10 mg/L). All models were adjusted for age, sex, race/ethnicity (black or white), smoking (current, former or never), education (less than high school, high school or equivalent, or college or above), alcohol use (currently, former or never), hypertension (yes/no), body mass index, history of diabetes (yes/no), previous stroke, systolic blood pressure, hs-CRP, NT-proBNP, fasting glucose, estimated glomerular filtration rate, total, low-density and high-density cholesterol levels.

