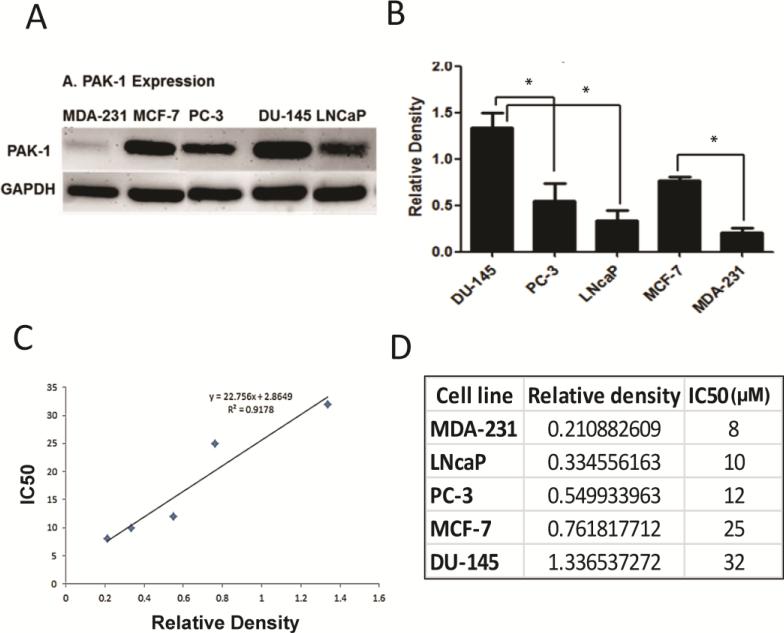
Figure 3.
Effect of IPA-3 in various prostate cancer cells relate to its expression levels. (A) Expression of PAK-1 in different prostate and breast cancer cell lines as determined by immunoblot analysis. (B)Histogram showing densitometry analysis of PAK-1 expression in the Western blots (n = 5). (C)Histogram showing correlation between PAK-1 expression and IC50 (μM) of PAK-1 inhibitor IPA-3 (n = 3). (D) Data presenting the linear correlation between PAK-1 expression and IPA-3 toxicity.Data are presented as the mean ± SEM; *p < 0.05.

