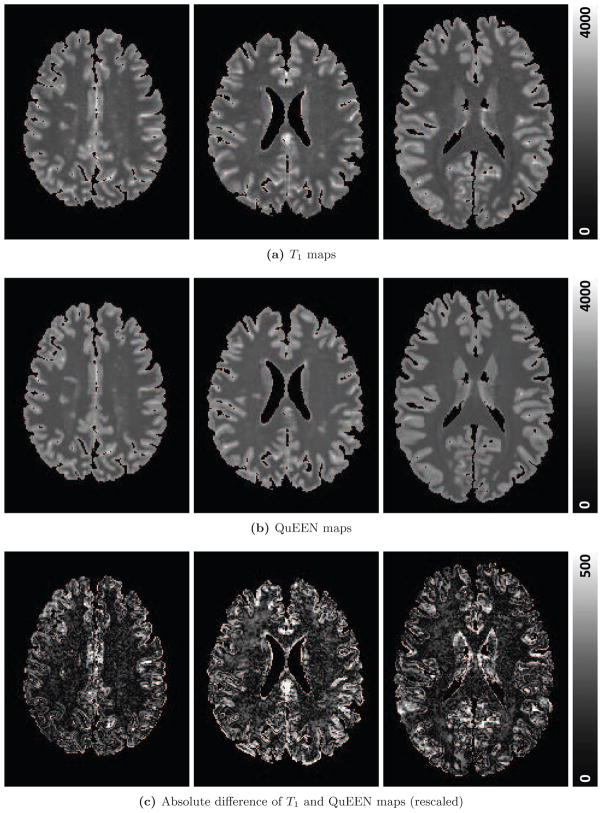
Figure A.1.
For three randomly selected subjects, one axial slice of the T1 map (a), the QuEEN map (b), and the absolute value of the difference between the two on a different scale (c) are shown. The first column shows a subject with SPMS, the middle column shows a subject with PPMS, and the third column shows a healthy volunteer.

